7.0 MODULE OVERVIEW AND OBJECTIVES
Welcome to Module 7
This module includes the following four sections:
- 7.1 Vocabulary
- 7.2 The role of irrigation in food production
- 7.3 Agriculture and water: the challenges
- 7.4 The future of agriculture and water
Module Objectives:
By the end of this module you should be able to
- Describe the spectrum of different approaches to agricultural water management (Module 7.1)
- Discuss why drainage is sometimes necessary and describe some potential environmental concerns associated with drainage (Module 7.1)
- List the benefits of agricultural irrigation (Module 7.2)
- Discuss the factors that make irrigation a key component of global food security (Module 7.2)
- Recognize that irrigated agriculture is 2 to 3 times more productive than rain fed agriculture (Module 7.2)
- Discuss why there is likely to be relatively little further expansion of the area of cultivated land worldwide (Module 7.2)
- Explain why, given the current global dietary trends, water demand for food production would continue to increase even if population growth stopped (Module 7.3)
- Recognize that most agricultural irrigation currently comes from blue water sources and that in many regions of the world, blue water sources are being heavily exploited leaving little room for expansion of irrigation using blue water (Module 7.3)
- Identify what property the Grace satellites measure and explain what these measurements have revealed about our agricultural water use (Module 7.3)
- List at least two agricultural regions where the Grace satellites have revealed significant declines in groundwater resources (Module 7.3)
- Discuss how water pricing policies might be part of the solution to the challenge of securing enough water for food production (Module 7.4)
- Discuss how localized irrigation vs. conventional irrigation can help ensure that we have adequate water to meet future food demand (Module 7.4)
- Describe how farming practices can help minimize the amount of water required for irrigation (Module 7.4)
- Explain why minimizing food waste would help us confront the “water for food crisis” (Module 7.4)
- Know the following definitions
- Renewable groundwater
- Aquifer over-exploitation
- Non-renewable groundwater
- Groundwater mining
- Fossil groundwater
- Green water
- Blue water
- Drain tiles
- Rainfed agriculture
- Irrigated agriculture
- Supplemental irrigation
- Water harvesting
- Dryland agriculture
- Conventional irrigation
- Surface, or flood irrigation
- Sprinkler irrigation
- Localized irrigation
- Drip irrigation
- Underground irrigation
- Sub-irrigation
Module assignments
- Module 7 quiz: Check the course schedule in Canvas to see when you need to take the quiz.
7.1 VOCABULARY: FOOD PRODUCTION AND WATER USE
Before we explore food production and water use in detail, we need to cover some vocabulary…
Renewable groundwater: Groundwater in settings where recharge occurs relatively quickly – on the order of 10’s of years. In these settings, as long as groundwater extraction does not greatly exceed recharge, groundwater will naturally be replenished relatively quickly.
Aquifer over-exploitation: Prolonged withdrawal of groundwater from an aquifer in quantities exceeding average annual recharge, bringing about a persistent fall in groundwater levels.
Non-renewable groundwater: Groundwater in settings where recharge occurs very slowly – on the order of 100’s to 1000’s of years. In these settings, groundwater is recharged so much more slowly than groundwater is used that groundwater is, for all practical purposes, non-renewable. Use of groundwater in from these areas is considered “groundwater mining”. The following series of figures show some typical settings where non-renewable groundwater occurs. Just some clarification of terms in the figures….
- vadose zone = unsaturated zone
- aquitard = confining unit
- groundwater table = water table
- phreatic vegetation = phreatophytes = vegetation adapted to living in arid regions that puts down very long roots to reach the water table.


Fossil groundwater: Groundwater that was recharged a very long time ago (>1000 years), typically under climatic conditions different than those today and that has been stored in the groundwater system since then.
Green water: The fraction of rainfall that infiltrates into the soil and is available to plants. Green water is the water that is used by rainfed plants. (See figure below)
Blue water: Surface water (lakes, reservoirs, rivers) and renewable groundwater. (See figure below)

Drain tiles: Perforated pipes installed below ground but above the water table. Excess soil water enters the pipes through the perforations. Once the water is in the pipe, the pipe carries it away from the agricultural field. This drainage of excess soil moisture from agricultural fields can improve crop production. However, drain tiles inhibit groundwater recharge and provide a pathway for agricultural contaminants (fertilizers and herbicides) to be transported long distances. Please read through this EPA website, which provides an overview of agricultural drainage. Pay particular attention to the following
- why subsurface drainage is sometimes needed (note the pictures of crop damage on the website)
- the potential environmental concerns related to drainage
Rain-fed agriculture: Agriculture that depends on rainfall for water. Crops in rain-fed agriculture must be able to cope with the natural inconsistency in timing and quantity of rainfall. Soil moisture conservation through farming practices like no till and leaving some plant residue on the ground to prevent the soil from drying out are key components of rain-fed agriculture.
Irrigated agriculture: Agricultural systems where the timing, intensity, and volume of water reaching crops is controlled by irrigation systems.
There is actually a spectrum of options in agricultural water management with purely rain-fed agriculture at one end and irrigated agriculture at the other end. (See figure below.)
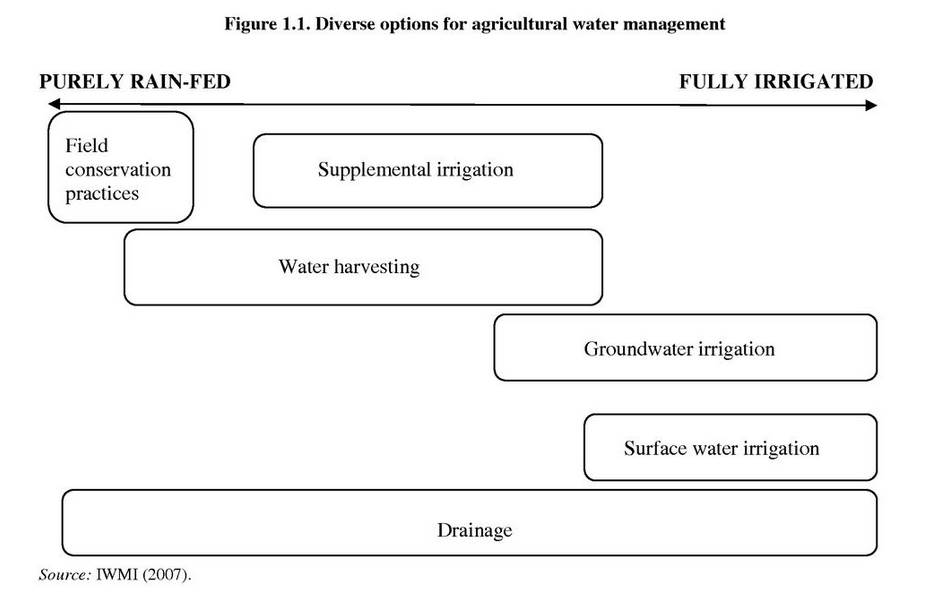
Supplemental irrigation: The occasional addition of small volumes of water to otherwise rain-fed crops during dry seasons or droughts.
Water harvesting: Collection of runoff to 1) store water for use during dry periods and 2) help prevent soil erosion.
Dryland agriculture: Rain-fed agriculture practiced in areas that receive less than 20 inches of rain per year.
Conventional irrigation: Surface irrigation and sprinkler irrigation are generally considered to be conventional irrigation methods. Surface irrigation is also called flood irrigation. This is the most commonly used irrigation method where fields are flooded, typically with water from canals. Sprinkler irrigation is exactly what you think of when you envision sprinklers, which are used to imitate rainfall. Large volumes of water are lost to evaporation without ever being used by the plants in conventional irrigation.
Localized irrigation: Water is applied only where it is needed, in a very controlled manner as close to the root zone as possible. Drip and underground irrigation are both types of localized irrigation. In drip irrigation, water is dripped through small holes in pipes on the soil above the root zone of individual plants. In underground irrigation, the porous pots or pipes are placed in the soil to keep the root zone moist.
7.2 THE ROLE OF IRRIGATION IN FOOD PRODUCTION
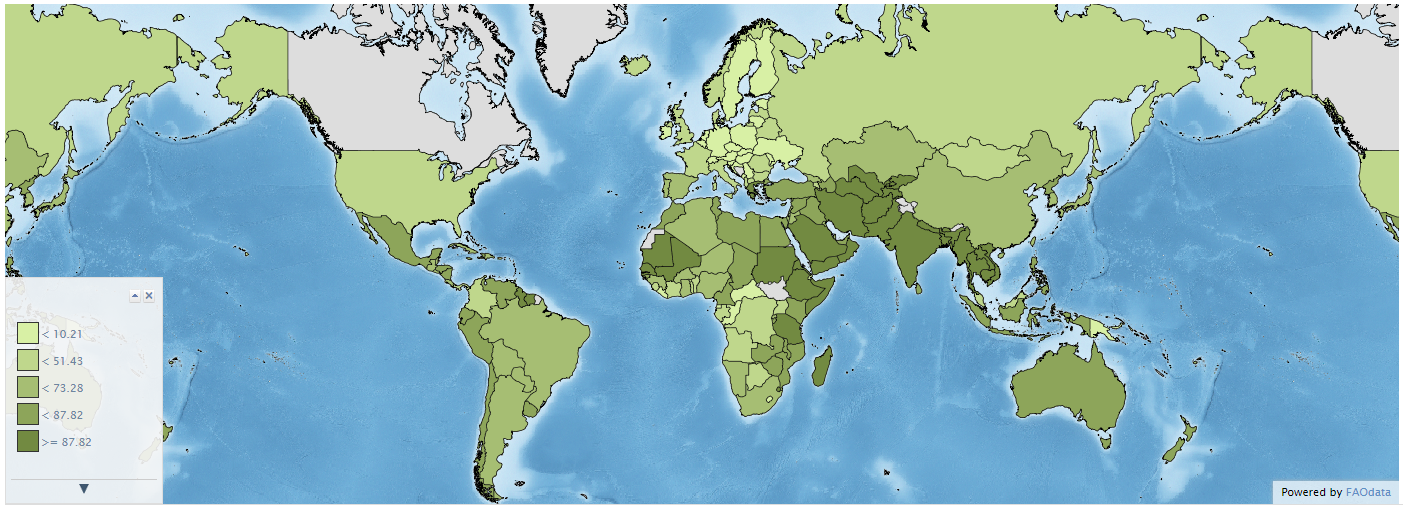
Recall from Module 5.6 that agriculture accounts for approximately 80% of consumptive water use worldwide. In fact as the map below shows, some countries use more than 90% of their water for agricultural purposes. Note that if you are interested, you can follow the link in the caption below to access an interactive map that let’s you click on individual countries to get exact values by country.
Obviously, irrigation provides water for crops, but it has many additional benefits. It significantly increases crop yield, cools the soil, leaches excess salt from the soil, and helps with the management of fertilizers. Additionally, irrigation often improves local economies. A study in Nebraska indicated that without irrigation, the state would have 31,221 fewer jobs. Additionally, land in Nebraska that is irrigated is between 35% and 45% more valuable than land that is not irrigated.
Agricultural irrigation sustains the large-scale farming that is necessary to provide food for the world’s growing population. Additionally, as the economies of developing countries improve, the demand for food increases. The following statistics emphasize the importance of irrigation for global food security.
Food production must increase significantly in the coming decades to support the growing human population as well as economic growth.
- “Food demand is expected to increase anywhere between 58% and 98% by 2050. This will shape agricultural markets in ways we have not seen before. Farmers worldwide will need to increase crop production, either by increasing the amount of agricultural land to grow crops or by enhancing productivity on existing agricultural lands.” (from: https://hbr.org/2016/04/global-demand-for-food-is-rising-can-we-meet-it)
Relatively little of the necessary increase in food production is likely to come from expanding agriculture to previously uncultivated land.
- Globally, there is a relatively large area of land suitable for agriculture that has not yet been brought into production. However, much of this land is less favorable for agriculture than the areas currently under cultivation. Therefore, without intensive and expensive management, crop yields would be relatively low on these lands. Additionally, many of these lands are in locations where the economic, political, and educational resources necessary to successfully cultivate marginal lands are not available. Furthermore, whenever new lands are brought into agricultural production the inherent environmental and social value of the land is lost.
Expansion of irrigated agriculture has significantly increased global food production in recent decades.
- On average, crop yields on irrigated lands are between 2 and 3 times higher than those on agricultural lands watered only with rainfall.
- On a global basis, only about 20% of the world’s agricultural lands are irrigated. Nearly 80% of cultivated land is rain-fed. However, the relatively small proportion of agricultural land that is irrigated provides approximately 60% of the world’s food.
- In the United States, only about 18% of the cultivated land is irrigated. However, 50% of U.S. agricultural revenues come from that relatively small fraction of agricultural lands that are irrigated.
- In the later half of the 20th century, food production outpaced population growth due mostly to increases in yield, rather than expansion of agricultural land. A significant portion of these yield increases were due to expansion of irrigation and improvements in water management on irrigated lands.
- Between 1961 and 2003, the area of irrigated land globally increased from 139 million ha to 288 million ha. (ha = hectare; 1 ha = 10,000 meters squared)
Please read through the following two articles as examples of some of the benefits of increasing the area of agricultural land under irrigation. As you read through the articles, pay particular attention the following…
- economic growth and improved lifestyles as a result of irrigation
- the distribution of increased profits brought about by irrigation
- the role of models in assessing the costs/benefits of irrigation
Benefits of irrigation including..
- higher crop yield
- economic growth
- increased job opportunities
Note that there are several other benefits of irrigation that are not specifically mentioned in the articles. These include…
reduced risk of crop failure due to lack of soil moisture
more efficient application of fertilizers and pesticides
cultivation of higher value crops than possible in rain-fed agriculture
Report looks at the benefits of irrigation expansion
Study says irrigating dryland would produce big economic benefits but would need government support
By Alberta Land Institute Release
May 3, 2018
Alberta Farmer
A recent report from the Alberta Land Institute highlights the economic benefits of expanding Alberta’s irrigation system and offers improved forecasting of agricultural and irrigation needs.
The report, entitled Systems modelling for sustainable land and water policy in Alberta’s irrigation sector, was prepared by Evan Davies, an associate professor in civil and environmental engineering at the University of Alberta.
The study, released in November, uses a new systems model — called CropSD — to assess sustainable land and water policy in Alberta’s irrigation sector. It is one of the most detailed model of its kind for river basins in Canada. CropSD simulates crop biomass and yield for six crop types; calculates irrigation demand for each crop based on on-farm irrigation technologies; gross irrigation water demands based on the conveyance network; and reservoir releases to satisfy irrigation demands.
Irrigation in Alberta generated nearly $3.2 billion to the province’s GDP in 2011, the report notes.
“The distribution of the benefits was 17 per cent for producers and 83 per cent for the province and the rest of Canada,” the report states. “These estimates suggest that the benefits of irrigation have almost tripled from 1980s estimates, while the share of those benefits accruing to producers has not significantly changed.”
The multi-year study found that expanding the irrigated area by 10 per cent (or 59,225 hectares) would produce a net-profit value of $78 million or $1,324 per hectare. However, such an expansion would be “economically unattractive for producers” unless government contributed 75 per cent of the costs for irrigation rehabilitation programs.
“The net benefits obtained from converting the dryland crops into irrigated crops are insufficient to cover the full investment costs required for irrigation expansion,” the report states.
This type of cutting-edge modelling systems are critical to policy-makers’ ability to manage Alberta’s water for municipal and agricultural activities, said Davies.
“With simulations running to 2040, our systems model serves as a decision-support tool at a high level of detail for municipalities, irrigation districts, government ministries, and other groups,” Davies said. “Specifically, for the City of Calgary, it generates medium- to long-term end-used-based water demand projections, and can be used to inform infrastructure and conservation planning.
“For irrigation districts, it simulates water efficiency, crop mix and infrastructure options, and projects crop production under various plausible future conditions. For provincial ministries, Alberta’s Watershed Planning and Advisory Councils and other groups, a fully realized model would provide detailed, long-term projections of watershed conditions; show possible consequences of water resources management options; and quantify trade-offs among water uses and their associated policies.”
There remains still work to do to couple the various models together between municipal, agricultural, and crop mix components, he added.
If stable water markets are the policy objective, then a water-sharing regime would be best regardless of the adequacy of the water supply, the study says. Such a flexible system will increase the welfare of licensed crop producers, livestock producers, the irrigation district and its members, it concludes.
WATER CAN BE A TRUE SOURCE OF PROSPERITY FOR CENTRAL ASIA
States News Service
June 21, 2018
Earlier this week, I met with colleagues in Dushanbe, the capital of Tajikistan, where I heard from them about the difficulty so many Tajik households still face in accessing that essential ingredient for life water. The challenges are especially acute in remote, rural areas of the country, where many communities have no direct access to safe drinking water, or to an irrigated water supply for farming. This is all the more surprising given that Tajikistan is rich in water resources.
In one story, I heard about the experiences of people in Lolazor, a village in Vahdat District, who had struggled for years to access irrigated water. This meant that they had perpetually low crop yields and therefore little income from the land. Job opportunities were scarce and times were hard.
But we also talked about how change and progress can happen. For example, recent improvements in farm irrigation and water drainage in the area around Lolazor have led to better lives for the villagers, as they no longer face a shortage of irrigated water. Indeed, the benefits go far beyond this: more agricultural crops are being yielded, more jobs are being created, and there is more hope now that fewer people will migrate abroad to find work.
Although Tajikistan is landlocked, its elevation and topography, largely consisting of glaciers and mountains, mean that water is abundant. Yet, poor water management and dilapidated irrigation infrastructure have meant that the country has not fully capitalized on this valuable resource. With more than two-thirds of Tajikistan’s population of 9 million people living in rural areas, lack of access to water continues to be a serious impediment to the country’s development.
A recent World Bank report, Glass Half Full, shows one in four households in Tajikistan do not have enough water. It also reveals long service interruptions because of breakdowns in water supply infrastructure, with rural residents experiencing more service interruptions that last a week or more.
Like Tajikistan, other countries in Central Asia have an abundance of natural resources, including water. But similarly, they face challenges in effectively managing water resources, and providing access to clean water and sanitation for all of their citizens. In some rural parts of the Kyrgyz Republic, for example, villagers only have access to water from irrigation ditches to wash clothes and even for cooking. In Uzbekistan, the households of more than half the population of roughly 31 million people remain unconnected to a piped water system.
And if that was not enough, climate change is also having a major impact melting glaciers in Central Asia and shifts in the timing of water flows are increasing the risk of torrential floods and reducing the amount of water available in summer months. The effects can also lead to a decrease in hydropower output by up to 20% in Tajikistan and the Kyrgyz Republic, which are both highly reliant on hydropower.
So, how can countries in Central Asia address the challenges and fully capitalize on the development opportunities offered by water?
I was highly encouraged by the productive discussions that took place this week, and in which I participated, at a High-Level International Water Conference in Dushanbe, hosted by the Government of Tajikistan and the United Nations. This conference brought together Presidents, Prime Ministers, and many others from around the world to find ways to address major water-related challenges.
Everyone agrees that the challenges cannot be solved by individual countries. Climate change with its impacts on water resources, the hydrological cycle, and surface and groundwater flows shows no respect for national boundaries. Adequate responses to climate change and effective management of water resources require the cooperation of all countries at the national, regional, and global levels.
Cross-border cooperation is also economically beneficial. Research suggests that regional cooperation in managing shared water resources could generate an additional US$ 4 billion per year for Central Asia. And as part of the High Level Panel On Water, Tajikistan has contributed substantially to cooperation.
Water permeates all aspects of life, which is why it has been interwoven into the Sustainable Development Goals (SDGs). SDG – 6 is dedicated to ensuring access to water and sanitation for all people around the world. Strategically, the SDGs are aligned with the World Bank Group’s twin goals of ending extreme poverty and boosting shared prosperity.
Together with our member countries, other development partners, the private sector, academia, and civil society, the World Bank is actively supporting Tajikistan, and other countries in Central Asia and around the world, to address water-related challenges and deliver on the 2030 Agenda of the Sustainable Development Goals.
As I think about the road ahead, I am reminded of Lolazor village. When my colleagues visited there a few months ago to view the irrigation works, one local woman told them, “We came together as a community and jointly resolved the most pressing issue we were facing the lack of water.”
If a similar approach is taken more broadly, at the regional-level, water can truly be a source of development and prosperity for the citizens of Central Asia.
7.3 AGRICULTURE AND WATER: THE CHALLENGES
As noted in section 7.2 global food production must increase by around 80% by 2050 in order to sustain the world’s population. Part of this necessary growth in agricultural production is due simply to population growth. However, another compounding factor is that demand for meat and dairy products is increasing, particularly in developing countries. The water footprint of diets high in animal proteins and fats is much greater than the water footprint of diets consisting mainly of fruits and vegetables. As a consequence of the increased demand for meat and dairy products, the water footprint of the typical diet increased by 25-30% between 1964 and 1999. Thus, if human’s current dietary trends continue, demand for water for food would continue to increase even if population growth were to suddenly cease.
“The desirability of reducing our carbon footprint is generally recognized, but the related and equally urgent need to reduce our water footprint is often overlooked. Recent research has shown that about 27% of the water footprint of humanity is related to the production of animal products (Mekonnen and Hoekstra, 2011). Only 4% of the water footprint of humanity relates to water use at home. This means that if people consider reducing their water footprint, they should look critically at their diet rather than at their water use in the kitchen, bathroom, and garden. Wasting water never makes sense, so saving water at home when possible is certainly advisable, but if we limit our actions to water reductions at home, many of the most severe water problems in the world would hardly be lessened. The water in the Murray-Darling basin in Australia is so scarce mostly because of water use in irrigated agriculture (Pittock and Connell, 2010). The Ogallala Aquifer in the American Midwest is gradually being depleted because of water abstractions for the irrigation of crops such as corn and wheat (McGuire, 2007). Much of the grain cultivated in the world is not for human consumption but for animal consumption. In the period from 2001 to 2007, on average 37% of the cereals produced in the world were used for animal feed [Food and Agriculture Organization of the United Nations (FAO), 2011].”
from: http://waterfootprint.org/media/downloads/Hoekstra-2012-Water-Meat-Dairy_1.pdf, last accessed 6/29/18
Section 7.2 also noted that there is not likely to be a significant increase in the global area of cultivated land. Therefore, most of the necessary increase in agricultural production will have to come from increased yields on existing agricultural land. Historically, we achieved large increases in agricultural yield by increasing the amount of irrigated land, with the majority of the water for irrigation coming from blue water sources (see Section 7.1). However, in many parts of the world, there is intense competition for blue water from competing interests (agriculture, industry, domestic, etc.), and there is not enough blue water remaining to allow for significant expansion of irrigated agriculture.
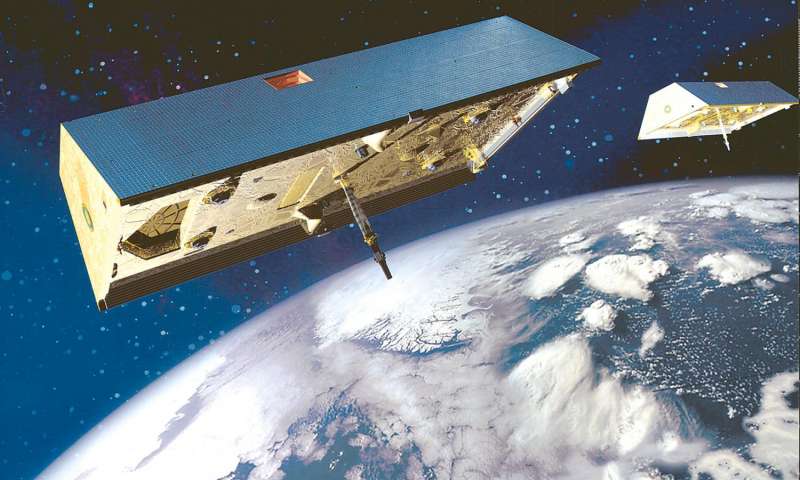
In many semi-arid and arid regions of the world, we have sustained agricultural production by irrigating with water from over-exploited or non-renewable aquifers. Satellite technology has revealed large agricultural regions where there has been substantial decline in groundwater resources. To learn about this satellite technology, read the following article. You should be able to briefly summarize what property the Grace satellites measures and how the Grace satellites track Earth’s water resources.
Excerpt from: 15 years of GRACE: Satellite mission flies thrice its planned time
https://phys.org/news/2017-03-years-grace-satellite-mission-flies.html, last accessed 6/30/17.
“Revolutionary” is a word you hear often when people talk about the GRACE mission. Since the twin satellites of the NASA/German Gravity Recovery and Climate Experiment (GRACE) launched on March 17, 2002, their data have transformed scientists’ view of how water moves and is stored around the planet. “GRACE enabled tracking the movement of water via its mass, a field which was not available in spaceborne remote sensing and which opened new options to monitor and quantify climate change,” said Reinhard Hüttl, the Chairman of the Board and Scientific Executive Director of the Helmholtz Centre Potsdam – GFZ German Research Centre for Geosciences.
Like many other revolutions, GRACE began with a radical idea. Principal investigator Byron Tapley (University of Texas Center for Space Research (UTCSR) at Austin) said, “The completely new idea about GRACE was the perception that measuring and tracking mass gives you a way to probe the Earth system.” Measuring changes in mass has been a key to discovering how water and the solid Earth are changing in places humans can’t go and can’t see.
The weight of water
The greater an object’s mass, the greater its gravitational pull. For example, the Alpes exert more gravitational pull than the flat North German Plain. Humans don’t notice the tiny difference, but satellites do. While orbiting Earth, satellites accelerate very slightly as they approach a massive feature and slow down as they move away.
The vast majority of Earth’s gravitational pull is due to the mass of Earth’s interior. A small part, however, is due to water on or near Earth’s surface. The ocean, rivers, glaciers and underground water change much more rapidly than the Earth’s interior does, responding to changing seasons and to storms, droughts and other weather and climate effects. GRACE grew from the recognition that a specially designed mission could actually observe these changes from space and reveal the hidden secrets of the water cycle.
GRACE measures changes in mass through their effects on twin satellites orbiting one behind the other about 220 kilometers apart. The spacecraft are constantly beaming microwave pulses at each other and timing the arrival of returning signals, which translates to the distance separating the twin satellites. Changes in gravitational pull alter that distance very slightly—by as little as a few microns’ width, that is, a fraction of the diameter of a human hair. GPS keeps track of where the spacecraft are relative to Earth’s surface, and on-board accelerometers records forces on the spacecraft other than gravity, such as atmospheric drag and solar radiation. Scientists process all these data to produce monthly maps of the regional variations in global gravity and the corresponding surface mass variations….
The future
At 15 years, GRACE has lasted three times as long as originally planned. Project managers have done everything possible to extend its life, but the spacecraft will run out of fuel soon—probably this summer. NASA and GFZ have been working since 2012 on a second GRACE mission called GRACE Follow-On, with Germany again procuring the launch vehicle, mission operations and the twin satellites built again at Airbus D&S in Germany.
GRACE-FO is scheduled for launch between Dec. 2017 and Feb. 2018. The new mission focuses on continuing GRACE’s successful data record.
Note that the Grace Follow-On mission launched on May 22nd, 2018. If you are interested in learning more about the follow-on mission, here is a link to the NASA website, https://gracefo.jpl.nasa.gov/.
To learn in more detail what the Grace satellites have revealed of the impact of agriculture on the Earth’s water resources, read the following article. You should be able to summarize what the Grace satellites have revealed about agricultural water use, particularly in the world’s bread baskets. Note that the article specifically refers to withdrawing groundwater faster than it is replenished. This is groundwater mining, one of the vocabulary words in this module.
Excerpt from: Agriculture is depleting world aquifers, new satellite measurements show
Ron Meador
MinnPost
4/7/17
https://www.minnpost.com/earth-journal/2017/04/agriculture-depleting-world-aquifers-new-satellite-measurements-show, last accessed 6/30/17
Unsustainable pumping of groundwater for irrigated agriculture is accelerating rapidly around the world, according to new research that matches crop production statistics against high-tech measurements of aquifer drawdowns.
Agriculture’s heavy demand on the world’s freshwater resources is well understood from the output end — of all water consumption for all uses, the United Nations estimates, 70 percent goes to produce food.
But the problem has been more difficult at the sourcing end, which requires distinguishing between perpetually replenished surface water from lakes and streams on the one hand, and essentially nonrenewable underground reserves on the other.
Quantifying the impact of withdrawals from aquifers has become a little easier since the introduction about 15 years ago of the satellite program known as GRACE, for Gravity Recovery and Climate Experiment, developed in a collaboration of the U.S. and German space programs.
Using a pair of satellites equipped with sensors that measure changes in the earth’s gravitational field, scientists can now visualize what’s going on with changing water volumes far below the surface (also, for that matter, with water locked in polar ice sheets).
For a paper published last week in the prestigious journal Nature, an international team of researchers — led by scientists at the UK’s Institute for Sustainable Resources and NASA’s Goddard Institute for Space Studies — looked at the gap between the rapid rate at which water is being withdrawn from aquifers and the very slow pace at which it is returned, essentially via rainfall and surface water filtering down through soil. Because most of the returns occur on time scales of many decades, at least, the gap amounts to a long-term depletion of groundwater resource.
But where is the water going?
To answer that question, the team made what appears to be the first effort to overlay depletion data with country-by-country statistics on agricultural output, to see how much of the loss could be attributed to food production.
They called the resulting measurement GWD — groundwater depletion for irrigation — and the numbers were rather grim in terms of the acceleration rate.
Depletion up 24 percent in just 10 years
In the year 2000, GWD was estimated at 19.47 cubic kilometers. By 2010, the endpoint of the analysis, it had risen to 24.14 km3 — an increase of 24 percent in just one decade. (If that volume measure seems unimpressively small, note that one cubic kilometer is 26.42 billion gallons.)
Of course, agricultural depletion is not uniform across the globe. About two-thirds of the GWD calculated for 2010 was in just four countries: India (7.35 km3), Iran (3.33 km3), Pakistan (2.75 km3) and China (2.40 km3). Almost 85 percent occurred in 10 nations — the top four plus the United States (1.62 km3), Mexico (1.11 km3), Libya (.25 km3), Turkey (.20 km3), and Italy (.20 km3).
During the decade that ended in 2010, the acceleration of GWD was most rapid in India (23 percent), China (102 percent) and the United States (31 percent).
Nor does all agriculture contribute equally, the researchers found:
The crops leading to the most depletion globally in 2010, both because of their large production and high GWD intensity, are wheat (22% of global GWD, or 65 km3/year) rice (17%), sugar crops (7%), cotton (7%) and maize (5%).
As a result of this, GWD itself is further concentrated within parts of the producing countries where output is highest:
Most GWD is concentrated in a few regions that rely significantly on overexploited aquifers to grow crops, mainly the USA, Mexico, the Middle East and North Africa, India, Pakistan and China, including almost all the major breadbaskets and population centres of the planet [my emphasis].
Both distribution factors raise obvious issues of food security — and so does a third, which the paper addresses at some length:
Food and water security
Because many of the crops driving GWD trends are globally traded commodities, the threats to agriculture posed by overconsumption of groundwater for irrigation are also threats to the economies of exporting countries, and to essential food supplies in importing countries.
Indeed, many countries where GWD is accelerating are both exporters and importers — the U.S., Mexico, Iran, Saudi Arabia and China are in the top tier on both sides of the trade ledger — and therefore face the dual risk of losing production capacity and access to food produced elsewhere.
This embedding of groundwater in globalized commodities also results in a “virtual water trade,” in which this most fundamental and local of resources is bought and sold across borders within what you might consider the “packaging” of grain, fiber and sugar. And this adds yet another dimension of insecurity:
A vast majority of the world’s population lives in countries sourcing nearly all their staple crop imports from partners who deplete groundwater to produce these crops, highlighting risks for global food and water security. Some countries, such as the USA, Mexico, Iran and China, are particularly exposed to these risks because they both produce and import food irrigated from rapidly depleting aquifers.
The big and unanswered question in this area, of course, is how much water remains in the world’s aquifers. GRACE can measure changes in volumes but not the volumes themselves.
Even where the situation has been studied closely, as with the Ogallala aquifer underlying the central U.S., and those beneath California’s Central Valley, the complexity and sheer scale of the geology and hydrology involved defy efforts to measure and forecast the available resource with confidence.
So we simply don’t know whether the glass is half full or half empty. We just know that it’s emptying out rapidly, that the rate is accelerating, and that replenishment will take may generations.
And now we are coming to know more about how heavily the depletion is being driven by agriculture, driven in turn by population growth and rising living standards around the world…
So, many experts believe that the primary challenge to global food security over the next several decades will be water availability. How do we achieve the necessary large gains in food production given the limited availability, seasonality, and unpredictable nature of our water resources? Continue on to the next section to learn about potential ways to address this challenge.
7.4 THE FUTURE OF AGRICULTURE AND GROUNDWATER
Confronting the challenge of producing more food with our available water resources will require a multi-faceted approach including, policy, technology, education, and lifestyle changes. Typically water pricing does not reflect the true cost of supplying the water. In fact, agricultural irrigation from private wells typically is free. Although most experts agree that pricing policies alone will not be adequate to overcome water shortages, the retooling of pricing policies to encourage water conservation is likely to be part of the solution to the”water for food” crisis. However, pricing policies must be well thought out and monitored to ensure that water allocation remains equitable, that monopolies do not develop, and that water use to meet basic human needs takes precedence over water use for non-essential comforts or economic gains. There is tremendous room for water savings through improved irrigation technology and maintenance of existing irrigation systems.
Click on the button to access a webpage that summarizes both conventional and localized irrigation. Read through the website paying particular attention to the following:
- the five basic types of irrigation
- the six keys to improving irrigation efficiency
- localized irrigation systems can improve crop yields in addition to saving water
Farming practices to conserve soil moisture can also help reduce the need for irrigation water use. Tilling (plowing) the soil exposes it to air and allows it dry out. Additionally, removal of soil cover promotes evaporative loss of soil water. Studies have shown that reduced tillage or no tillage farming and leaving plant residue on the soil improve soil moisture retention. One recent study in California showed that fields which were not tilled and had plant residue left on them to cover the soil had 13% less evaporative soil moisture loss during the summer growing season than fields with bare soil and conventional tillage. Additionally, growing crops that require less water and genetically modifying plants to use less water will reduce agricultural water use.
Harvesting of rainwater from rooftops or from the ground, using tanks or hand dug holes can help farmers secure water to use for irrigation during dry periods. Water harvesting is particularly effective at small scales.
Nearly 1/3 of all food produced for human consumption is wasted. The land required to grow this food that is never consumed represents about 30% of the world’s agricultural area. Two hundred and fifty cubic kilometers of water are used every year to grow food that is never consumed. This is enough water to supply all the world’s households for 1 year. By minimizing food waste, we could make better use of the agricultural land already in production and reduce the wasted use of water to grow food that either gets thrown away or rots in the fields.
Finally, promoting less consumption of meat and dairy products, would reduce the water footprint of the typical meal and would therefore enable us to feed more people with less water.
END OF MODULE 7