2.0 MODULE OVERVIEW AND OBJECTIVES
Welcome to Module 2
This module includes the following four sections:
2.1 Math review
2.2 Precipitation measurements
2.3 Evaporation and transpiration
2.4 Introduction to streamflow
2.5 Water balance calculations
Module objectives (Use these to help guide your note taking and studying):
By the end of this module you should be able to
Determine the appropriate number of significant figures to report in quantitative answers (section 2.1)
Explain/give an example of why significant figures are important (section 2.1)
Convert units as needed to complete quantitative problems (section 2.1)
List the common methods of measuring precipitation and their advantages and disadvantages (section 2.2).
Briefly describe what the Z-R relation is and list several things that influence the Z-R relationship. Recognize that radar estimates of rainfall are complicated because the Z-R relationship is not constant in space or time (section 2.2)
List the conditions that are necessary for good radar coverage (section 2.2)
Recognize that rain gauges provide point measurements, not areal estimates, of precipitation (section 2.2)
Describe factors that can cause errors in rain gauge measurements (section 2.2)
Calculate the effective uniform depth of precipitation using appropriate averaging techniques and rain gauge data (section 2.2)
Define evaporation, transpiration, and evapotranspiration (section 2.3)
Describe the typical ranges of evapotranspiration across different environments (section 2.3)
Describe typical ways of measuring or estimating evaporation, transpiration, or both and explain the advantages and limitations of each (section 2.3)
Describe common methods of measuring stage, stream velocity, and discharge (section 2.4)
Explain what a rating curve is and how it is used (section 2.4)
Use the water balance equation to calculate unknown fluxes of water (section 2.5)
Know the following definitions
- QPE
- QPF
- Hydrometeor
- Convective precipitation
- Stratiform precipitation
- Polarimetric radar
- Effective uniform depth
- Transpiration
- Evaporation
- Evapotranspiration
- Lysimeters
- Stage
- Discharge
- Weir
- Flume
- ADCP
Module assignments
- Modules 1 & 2 Reflection Discussion Board: Check the course schedule in Canvas for the due dates for original post and replies.
- Homework 1: Check Canvas for the assignment and due date.
2.1 MATH REVIEW
Module 2 focuses on hydrologic measurement techniques and water balance calculations. Since this material is quantitative in nature, this section provides a review of some basic math skills including significant figures and unit conversions to help prepare you for the quantitative homework and exam problems.
Watch the video below for an overview of unit conversions and significant figures. Note that although parts of the video focus on chemistry, the information is relevant to all quantitative subjects.
Video embedded from: https://www.youtube.com/watch?v=hQpQ0hxVNTg&t. Last accessed 3/29/17.
Now let’s do some practice. Work your way through the significant figure tutorial below.
Now work your way through the unit conversion tutorial below.
Expectations for Quantitative Problems in this Class
Here is a summary of my expectations for all the quantitative problems on homeworks, quizzes, and exams in this class.
- Include an equation that shows the unknown parameter you are solving for.
- Present your work in a sequential and neat fashion.
- Either include the math for unit conversions or clearly indicate “unit conversion” so if a number suddenly changes value, I know why when I am grading your work.
- All quantitative answers should include units.
- Quantitative answers should be reported to the appropriate number of significant figures. Include enough of your work on quantitative problems that I can follow what you did.
2.2 PRECIPITATION MEASUREMENTS
Vocabulary
Before we get into details of precipitation measurements, look over the following vocabulary.
- Hydrometeor – A particle of condensed water (liquid, snow, ice, hail) in the atmosphere
- Convective precipitation – This is the type of precipitation that falls during intense thunderstorms. Typically these storms are vertically extensive but have a limited horizontal extent.
- Stratiform precipitation – Typically, stratiform precipitation is associated with frontal systems. These storm systems are typically less vertically extensive and can be more horizontally extensive than convective systems.
- Polarimetric radar – Whereas most weather radars transmit radio waves horizontally, polarimetric radars transmit radio waves both horizontally and vertically. The additional information gained from the multidirectional radio wave pulses helps improve estimates of rain and snow rates and helps identify hail.
- Effective uniform depth (EUD) – The average depth of precipitation over a basin. Determined by averaging several point measurements of precipitation. There are several different averaging techniques that can be used to determine EUD. The characteristics of the rainfall and the basin determine which averaging technique is the most appropriate to use.
Overview of Precipitation Measurements
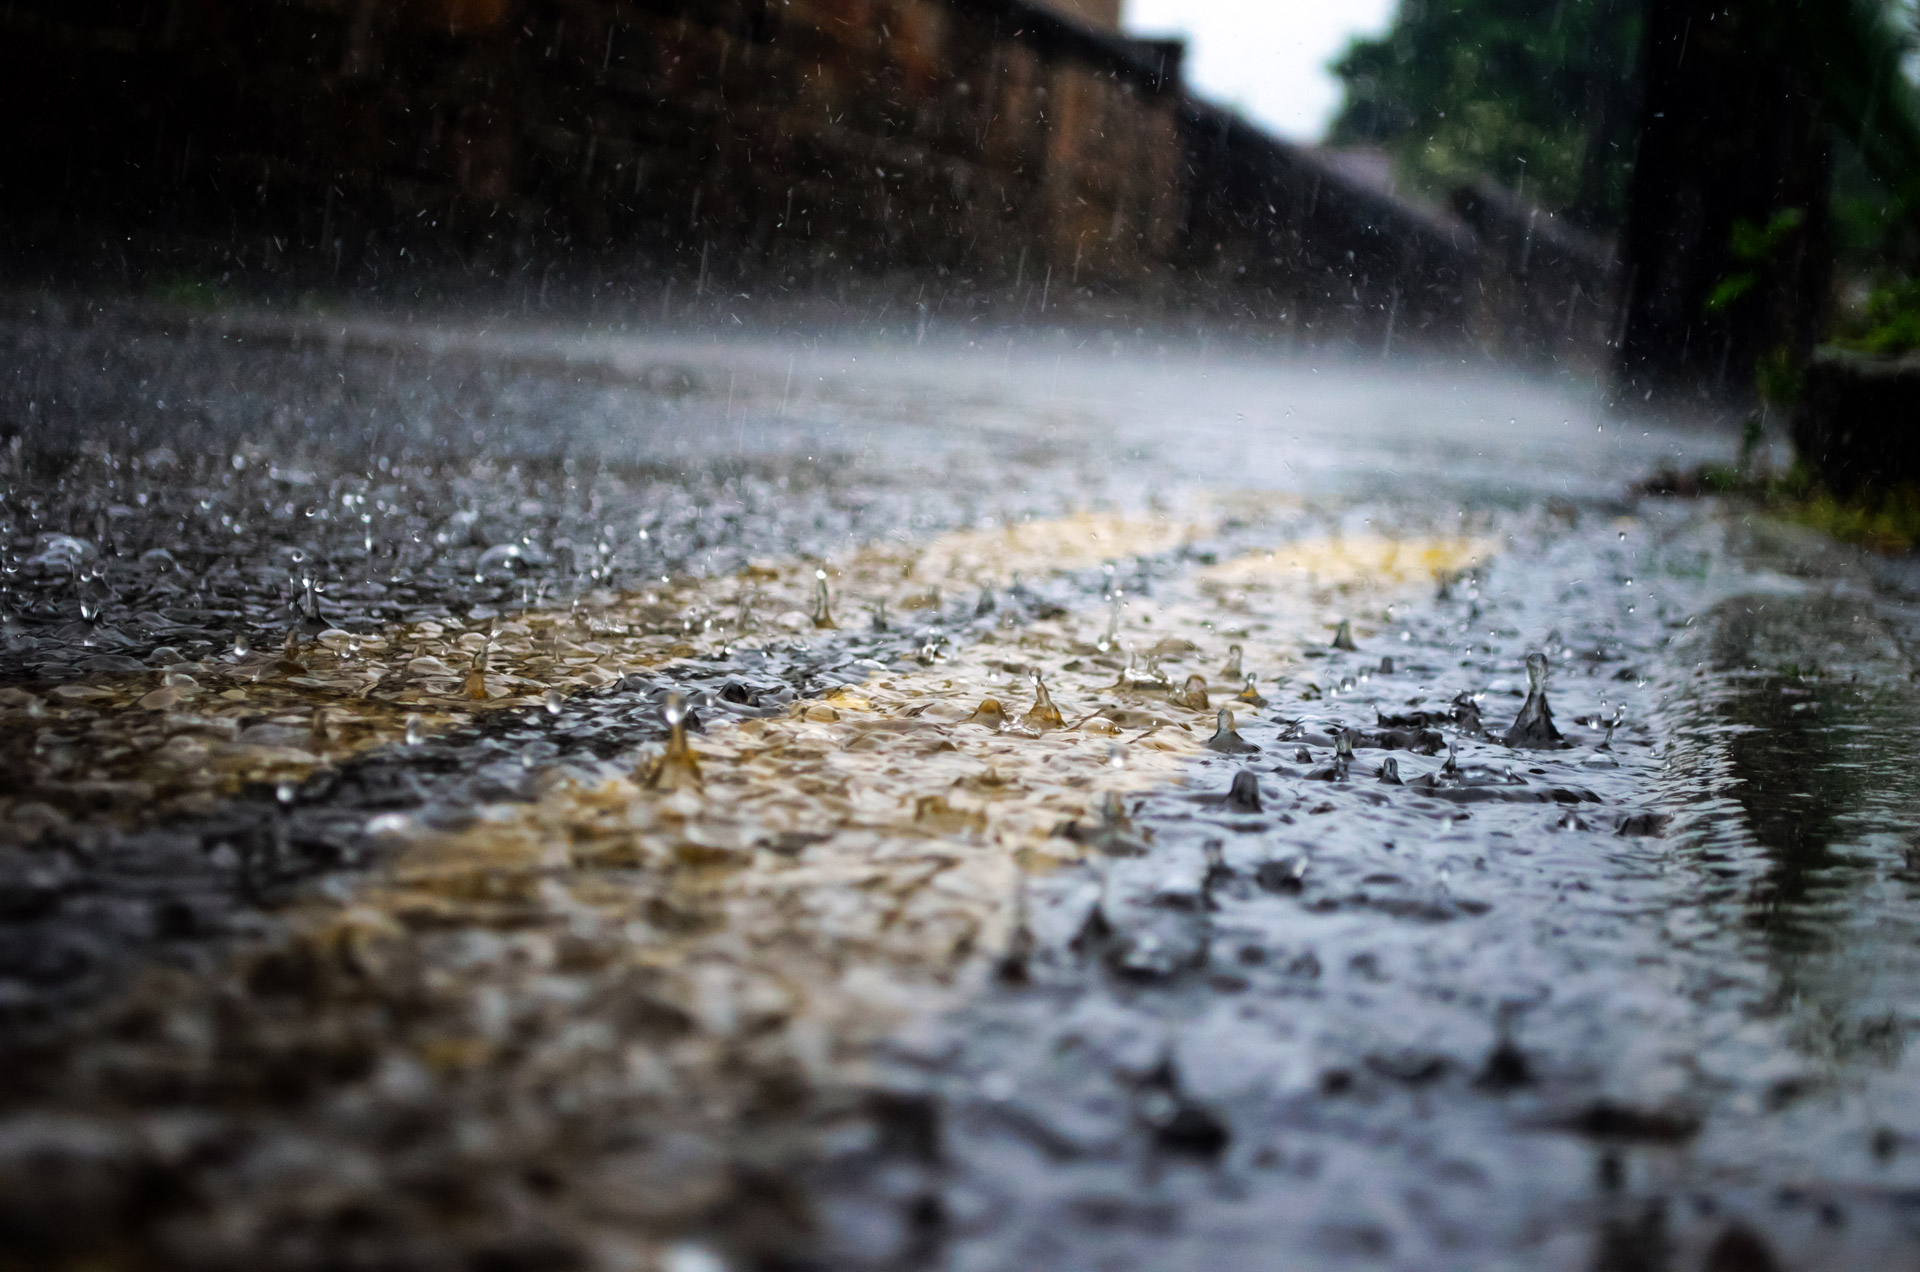
Although precipitation measurements are something we hear reported on weather reports multiple times a day, measuring the amount of precipitation that falls is not as straight forward as it might seem.
To learn about different types of precipitation measurements, we are going to go through an online module developed by the COMET Program. You will need to register and create a username and password in order to access the module. The COMET Program requires registration in order to gather statistics about the usage of their products, but registration is free.
Follow the instructions below to register on the COMET site and access the module.
1. Click the button below to register for the COMET program.
2. After you register, login to the COMET site.

3. While you are logged in to the COMET site, type or copy and paste the following url into your web browser http://www.meted.ucar.edu/hydro/precip_est/part1_measurement/index.htm. This should get you the starting page of the module, which looks like the picture to the right.
4. If you are unable to access the interactive version of the module, you can access the print version of the module by clicking here.
5. Below are a few tips to help you focus your studying as you go through the module.
- Feel free to do the pre-assessment if you would like to, but it is not required for this class.
- Focus on the Remote Sensing of QPE and Rain Gauge QPE sections of the module. There is nothing in the introduction or in the Precip Climo/PRISM sections that you need to know for this class.
- The module contains more detail than what you need to know for this class, so pay particular attention to the following topics…
-QPE and QPF
-Advantages and limitations of radar, satellite, and rain gauge measurements
-Briefly describe what the Z-R relationship is and list several things that influence the Z-R relationship. Recognize that radar estimates of rainfall are complicated because the Z-R relationship is not constant in space or time.
-List the conditions that are necessary for good radar coverage.
-Recognize that rain gauges provide point measurements, not areal estimates, of precipitation.
-Describe factors that can cause errors in rain gauge measurements.
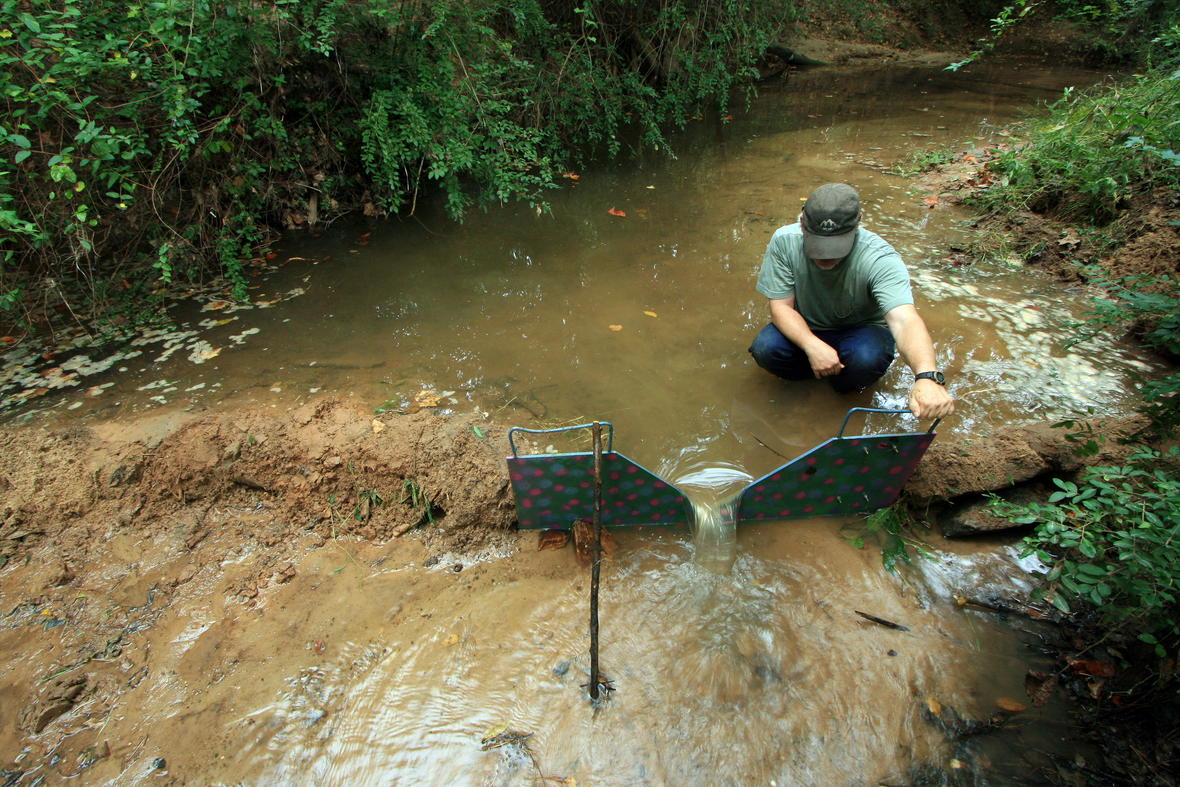
Areal estimates of precipitation from point data
Precipitation data from rain and snow gauges is point data; however, when we are determining how much water is available in a region, we need to know how much precipitation fell over an area rather than how much precipitation fell at single point. There are several different procedures for averaging point precipitation data to determine effective uniform depth (EUD), or the average precipitation over an area.
Watch the following two-part screencast to learn about these different methods. (Note that this is an older screencast that shows me using a web-demo that is no longer available. I think the online demos are still useful so I want to show the video still, but I have set the link below to start a couple of minutes into the video to cut out some parts that are no longer relevant to this course. At the end of Part 2 of the screencast I show some links to additional information in Blackboard. Obviously that is dated too, but all those links are available in Module 2 in Canvas, and I strongly encourage you to study that supplemental information.)
Embedded from: https://www.youtube.com/watch?v=Cfd5F_XQqNs&t=138s
Embedded from: https://www.youtube.com/watch?v=LfmqfjOU8RY
2.3 EVAPORATION AND TRANSPIRATION

To learn about the processes of evaporation and transpiration and how we estimate how much evaporation and transpiration take place, watch the video below.
2.4 INTRODUCTION TO STREAMFLOW
Another parameter that is often measured and involved in water resources calculations is streamflow.
The United States Geological Survey (USGS) is the federal agency charged with streamgaging throughout the country, and they have a web page with a very thorough overview of streamflow and how it is measured.
Please read through the material on the following website carefully. As you read through the site, be sure to pay close attention to the following:
1. What is the definition of stage?
2. What is the definition of discharge? (Note, in this class we will use the symbol Q to represent discharge.)
3. How is stage commonly measured?
4. How is stream velocity commonly measured?
5. What is an ADCP and what is it used for?
6. What is a rating curve (stage-discharge relationship) and how are rating curves used?
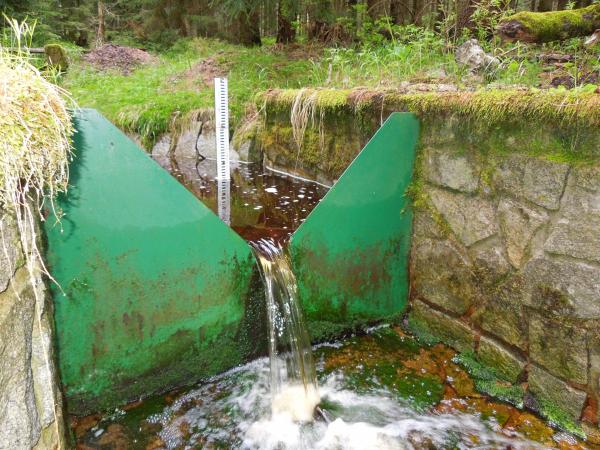
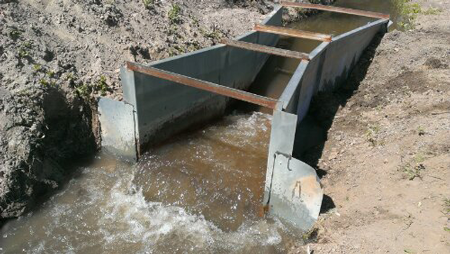
Weirs and flumes
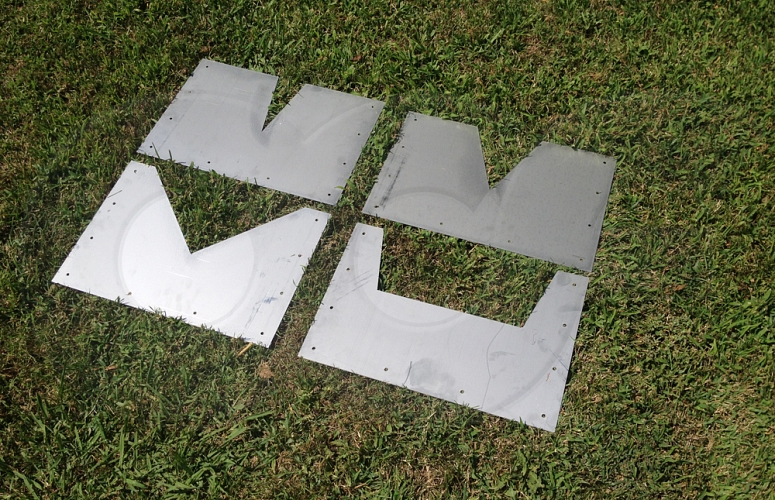
The above article does not mention weirs or flumes, which are two other common ways to measure streamflow. A weir is an engineered obstruction placed in the stream channel. As discharge increases the depth of water flowing over the weir increases. Weirs come in a variety of shapes and sizes. Each specific weir has a “weir equation” associated with it that relates the height of the water behind the weir to the discharge going through the weir. So to monitor discharge using a weir, the height of water upstream of the weir is the measured parameter, and discharge is calculated using the appropriate weir equation. Weirs can either be semi-permanent structures installed for long-term discharge monitoring in larger streams or small portable devices used to make short-term measurements in small, shallow streams. Weirs can have the added advantages of reducing the gradient in streams and serving as sediment traps, and they are often used in irrigation canals.
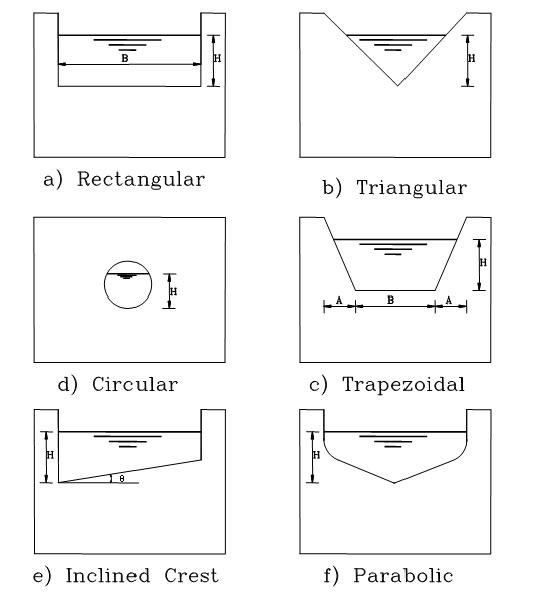
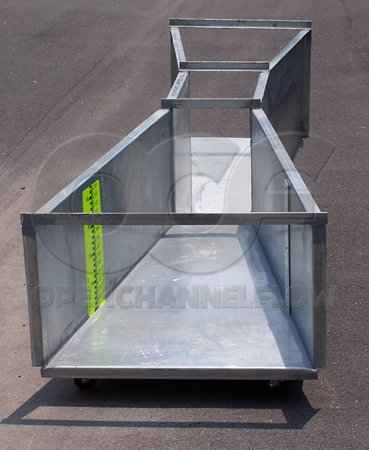
Flumes are similar to weirs in that they are engineered structures placed in stream channels, and the height of water in the flume is proportional to the discharge going through the flume. However, flumes are “flow-through” structures rather than obstructions. Because the water flows-through the flume they do not have as much impact on reducing the stream gradient as weirs do. They also tend to not get clogged with debris as easily as weirs do and have a smaller footprint than weirs. Flumes are also commonly used in irrigation canals as a way to monitor that users are not taking more water than allotted by their water rights.
2.5 WATER BALANCE CALCULATIONS
So far in this module we have covered ways to measure different components of the water cycle including
- precipitation
- evapotranspiration, and
- streamflow.
Now we are going to put all those parameters together and learn about water balance calculations.
Please watch the following video for an introduction to water balance problems.
Note: While water balance problems require no math beyond addition, subtraction, multiplication, and division, they involve a lot of parameters and it can be difficult to keep track of all the components of a problem. They also often require unit conversions. There will be water balance problems on homeworks and exams. Therefore, it is important that you spend time watching the following video and working through the practice problems on Canvas so that you become comfortable with all of the steps in water balance problems.
Embedded from: https://www.youtube.com/watch?v=DpOIwWaTnCs.