4.0 MODULE OVERVIEW AND OBJECTIVES
Welcome to Module 4
This module includes the following four sections:
- 4.1 Watersheds
- 4.2 Lakes
- 4.3 Rivers and streams
Module objectives (Use these to help guide your note taking and studying):
By the end of this module you should be able to
- Explain why we study and manage water resources within the framework of watersheds (section 4.1)
- Know who first suggested the concept of a watershed and why (section 4.1)
- Know that the majority of the world’s lake water is in relatively few large lakes and know which lakes are the largest (section 4.2)
- Briefly summarize the ways that lakes commonly form (section 4.2)
- Understand that individual lakes are very heterogeneous (chemically, physically, and biologically) both in space and time.
- Explain why lakes stratify and then turnover (section 4.2)
- Explain the importance and benefits of riparian zones (section 4.3)
- Explain what a hydrograph is and how hydrographs are used (section 4.3)
- List factors that influence the shape of a hydrograph (section 4.3)
- Explain lagtime and peak discharge and factors that influence them (section 4.3)
- Explain why the natural sequence of pools and riffles is important for stream ecology (section 4.3)
- Describe the long-term effects of stream channelization (section 4.3)
- Define the following
- Surface water (section 4.1)
- Watershed (section 4.1)
- Limnology (section 4.2)
- Vertical extinction coefficient (section 4.2)
- Euphotic zone (section 4.2)
- Light attenuation (section 4.2)
- Secchi disk (section 4.2)
- Isothermal (section 4.2)
- Density stratification (section 4.2)
- Turnover (section 4.2)
- Epilimnion (section 4.2)
- Metalimnion (section 4.2)
- Hypolimnion (section 4.2)
- Thermocline (section 4.2)
- Dimictic (section 4.2)
- Monomictic (section 4.2)
- Polymictic (section 4.2)
- Meromictic (section 4.2)
- Riparian zone (section 4.3)
- Headwater stream (section 4.3)
- Perennial stream (section 4.3)
- Ephemeral stream (section 4.3)
- Intermittent spring (section 4.3)
- Interflow (section 4.3)
- Baseflow (section 4.3)
- Hydrograph (section 4.3)
- Pool (section 4.3)
- Riffle (section 4.3)
Module assignments
- Module 4 Quiz: Check the course schedule in canvas to see when you need to take the quiz.
4.1 WATERSHEDS
“In central Colorado the Continental Divide is a wilderness of desolate peaks that rise far above the timber line into regions of rime and naked rock. Here, with other rivers, springs the Arkansas, in deep canyons and narrow rocky valleys. Many silver creeks, with water flashing in cascades, unite to form a river which plunges down a steep mountain valley until it passes the foothills and spreads in a broad, turbid stream at the head of the great valley of the Arkansas. Then it creeps over the sands in tawny ripples, down the incline of the plains, becoming less in volume by evaporation and the absorption of the waters in the sands, but growing in size from the accession of smaller tributaries that come from distant mountains on either hand.”
John Wesley Powell
Water in a lake is connected to the rivers flowing in and out and those rivers are connected to other rivers and possibly wetlands or springs. The rivers’ characteristics are dependent on the region’s climate, topography, and land cover. Since the ecology in an area is dependent on both the quantity and quality of water available, it is very difficult to study just the hydrology without also considering all these various factors that interact with it. This is why we often study and manage water resources within the framework of a watershed.
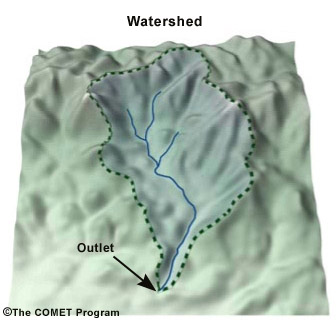
A watershed is the area of land that all drains to the same river, lake, or other body of water. The land, plants, and animals in a watershed are all connected by the water that flows through the watershed. Basin, river basin, and catchment are all other terms that are used interchangeably with watershed. However, the term river basin is often used to describe a larger area made up of several watersheds.
To learn more about watersheds, we are going to go through another online tutorial from the Comet Program. You will need to login using the same ID and password as in previous modules.
Follow the instructions below to work your way through Watersheds: Connecting Weather to the Environment.
1. Click the button below and login.
2. You will need to allow Adobe Flash to run on your computer for this tutorial.
3. After logging in and allowing Flash to run, you should see a website that looks like the picture below.

4. Work your way through the tutorial by clicking on each component in turn.
5. Below are a few tips to help you focus your studying as you go through the tutorial.
- The video they provide about John Wesley Powell is incredibly slow to load and not terribly informative. Read through the information at the following links for more informative background on John Wesley Powell.
- You do not need to know any specifics about the pollutants covered in Panel 4. Just take Panel 4 as an example of why the watershed concept is a useful framework for water resources research and management.
4.2 LAKES
Introduction
To get us started with learning about lakes, here are some facts about lakes worldwide.
1. Lakes cover about 2% of the world’s terrestrial surface area
2. Lake Superior is the world’s largest freshwater lake in terms of surface area.
3. Lake Baikal in Siberia is the world’s largest freshwater lake in terms of volume.
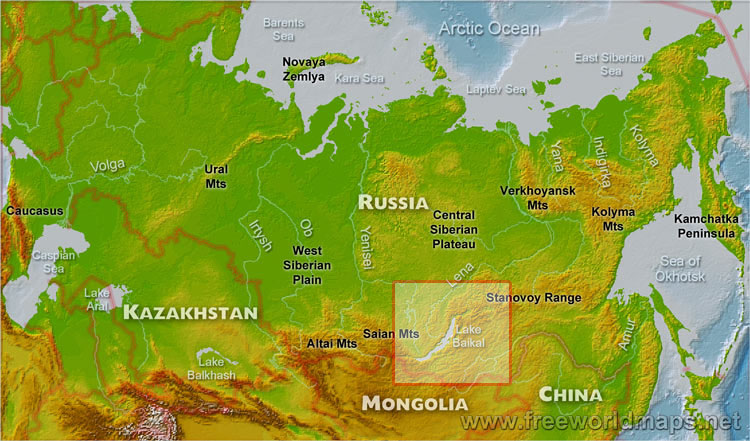
- Lake Baikal’s maximum depth is over 1600 m, and it holds approximately 20% of the world’s freshwater (not including the ice sheets)
- Lake Baikal contains more water than all the North American great lakes combined.
- Check out this website to learn more about Lake Baikal.
- Lake Baikal was designated as a World Heritage by UNESCO in 1996.
- Historically it was thought that Lake Baikal held so much water that it would absorb significant amounts of pollution without adverse impacts. However, there has been a lot of recent concern about the health of Lake Baikal due harmful algal blooms, decline in fish populations, and mass seal deaths.
4. Most of the world’s freshwater lakes are at high latitudes. More than 50% of the world’s freshwater lakes occur in Canada.
5. Most of the world’s lakes are relatively shallow and small in surface area.
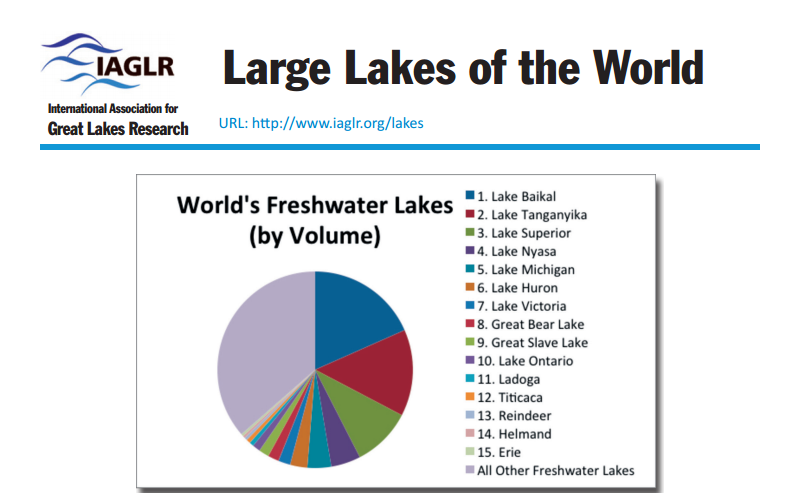
- The International Association for Great Lakes Research estimates that 90% of the world’s lake water is in only 350 lakes.
- There are only 19 “great lakes”, which have surface areas larger than 10,000 square kilometers.
- There are approximately 145,000 large and medium lakes, which have surface areas between 1 and 10,000 square kilometers.
- There are nearly 300,000,000 small lakes and ponds, which have surface areas of less than 1 square kilometer.
Below is a list of the world’s largest freshwater lakes by volume.
Origins of Lakes
To learn about how different types of lakes form, watch the 2-part video lecture below.
Physical Structure and Characteristics of Lakes
We are going to go through parts of an online learning module from Water on the Web to learn more about the physical structure and characteristics of lakes. The sections below provide links to the relevant parts of the Water on the Web module, list important concepts to help you focus your learning, and provide some supplemental information.
Lake Variability
The important concept for you to take away from the lake variability section of the Water on Web module is that individual lakes are chemically, biologically, and physically heterogeneous, both in space and time.
Light in Lakes
There are a lot of important concepts in this section of the Water on the Web module, including the following vocabulary:
- Vertical extinction coefficient
- Euphotic zone
- Light attenuation
- Secchi disk
Water on the Web does not provide much detail about secchi disks. To learn more about secchi disks, watch the short video below.
Embedded from:https://www.youtube.com/watch?v=sQTs0lglYZI, last accessed 4/30/17.
Density Stratification in Lakes
This is another portion of the module with a lot of important concepts including the following vocabulary:
- Isothermal
- Turnover
- Epilimnion
- Metalimnion
- Hypolimnion
- Thermoclime
- Dimictic
- Monomictic
- Polymictic
- Meromictic
Unfortunately the videos demonstrating density stratification on the Water on the Web site are very poor quality; although, the explanation of stratification and turnover is very good. Here are links to a series of YouTube videos that do a good job of showing stratification and turnover in a laboratory demonstration. They are a bit long, but should be very helpful in understanding stratification and turnover. http://www.youtube.com/watch?v=XExQ6uaDEJQ and http://www.youtube.com/watch?v=DlT51AosbcA. And here is one more short video lecture from an introductory biology class that explains lake turnover and stratification. The Water on the Web site, the videos with the laboratory demo, and the video lecture all cover the same material about lake stratification and turnover, just in different formats. I have included them all so you can pick whichever formats are most helpful for you.
4.3 RIVERS AND STREAMS
Introduction

Rivers are used for drinking water, crop irrigation, hydroelectricity generation, and recreation. Rivers and streams are critical in transporting runoff from storms. Additionally, through erosion and transport of sediment, rivers play a significant role in shaping the landscape and transporting chemicals throughout their watersheds.
Here are some facts and statistics about some of the world’s most significant rivers.
- There are over 3.5 million miles of rivers and streams in the U.S.
- The longest river in the world is the Nile, stretching over 4,100 miles.
- The Amazon passes through 6 countries and 3 time zones along its 4,000 mile journey through South America.
- The Mississippi River’s watershed covers more than 1.2 million square miles. Together with its largest tributary, the Missouri River, it drains all or part of 31 states.
- The Yangtze River is the longest river in China. It is one of the world’s busiest waterways and is also home to the world’s largest hydroelectric dam, the Three Gorges Dam.
Below is a summary of the world’s longest rivers.

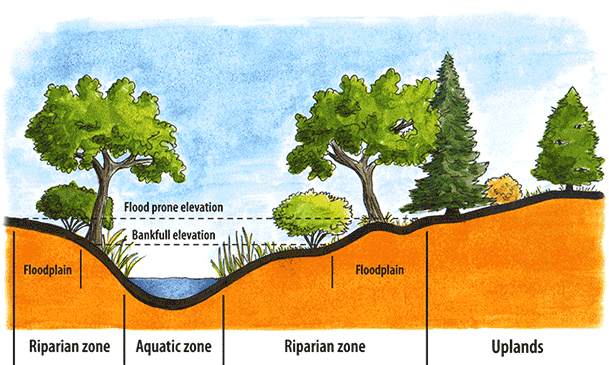
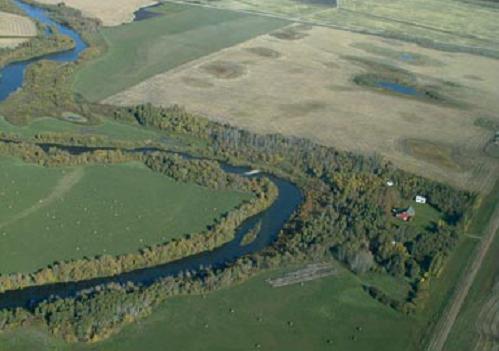
Riparian areas
“Riparian habitats are those adjacent to rivers and streams or occurring on nearby floodplains and terraces. Riparian habitats are shaped and maintained through seasonal flooding, scour, and soil deposition. Floods replenish nutrients, recharge groundwater, and reset successional processes.”
To learn more about riparian areas, watch the video below. Pay particular attention to the following as you watch the video.
- The definition of riparian
- Riparian buffers can be natural or man-made
- The primary and secondary purposes and benefits of riparian buffers
Embedded from https://www.youtube.com/watch?v=J3-IVkOgF9g, last accessed 6/31/18.
“In the western United States, riparian areas comprise less than 1 percent of the land area, but they are among the most productive and valuable natural resources. There is a significant difference between the water-rich riparian areas and the arid uplands. Riparian areas are the major providers of habitat for endangered and threatened species in the western desert areas. In the humid east, the riparian areas are more similar to the uplands. In many areas, the separation of the riparian zone from the upland is not distinct.”
From: https://www.nrcs.usda.gov/wps/portal/nrcs/detail/national/technical/?cid=nrcs143_014199, last accessed 4/30/17.
Streams
Although many streams only flow intermittently and are too small to show up on maps or to even be named, they make up a significant portion of the world’s freshwater and are incredibly important to the health of their watersheds. To learn more about small streams, please read through the following EPA website.
As you go through the website, pay particular attention to the following:
- The definition of headwater streams
- The definition of perennial streams
- The definition of ephemeral
- The definition of intermittent springs
- The importance of streams (Be able to list some of the important functions of streams.)
Runoff Processes
To learn more about runoff processes, we will review Runoff section of the COMET program website on the hydrologic cycle that we have used in before. You will need to login using the same ID and password as in previous modules.
Follow the instructions below to work your way through the Runoff section of the Comet Program’s Hydrologic Cycle module.
1. Click the button below and login.
2. After logging in, you should see a webpage that looks like the picture below.

3. Read through the information on the webpage, paying particular attention to the following:
- The definitions of interflow and baseflow
- What a hydrograph shows
More About Hydrographs
Hydrographs are very important for understanding runoff and predicting how a river basin will respond to storm events. Planners, civil engineers, and even insurance companies rely heavily on hydrographs because they can be used to design storm water management systems for a city and predict the magnitude and duration of flooding. Consider the hydrograph below:
The new term you should examine is that of Lag Time. Lag time is defined as the amount of time between the peak rainfall and the corresponding peak discharge. The length of lag time, the amplitude of peak discharge, and the length of peak discharge can vary for a number of reasons. The shape of a hydrograph depends on a variety of factors including:
- Rainfall intensity
As we explored in the previous module with the calculation of the Effective Uniform Depth (EUD), precipitation can vary for a number of reasons across a watershed. One reason why two neighboring streams may have different peak discharges could be the intensity of rainfall, the amount and rate of precipitation. A steady, long lasting storm would likely have a longer lag time and lower peak discharge than that of a torrential downpour.
- Preceding soil moisture conditions
When rainfall exceeds the capacity of the soil to hold moisture, any additional rainfall will become surface runoff. This is why repeated small storms can cause significant flooding, when the storage capacity of the watershed’s soil is filled the bulk of the next storm will likely flow overland into streams and be recorded as a short lag time and high peak discharge.
- The topography of the watershed
If a watershed is perfectly flat, all overland flow will make its way into streams. However if the terrain has natural or artificial depressions (Grabben vs stormwater catchment), this overland flow can be captured. These physical obstructions store overland flow as temporary ponds, that will then infiltrate into the groundwater.
- Land use/land cover in the watershed
In the graph below, the primary reason for the difference between the two hydrographs is the surrounding land use and cover. Please follow the button below to explore this relationship. You should be able to explain how urban development changes the shape of a hydrograph and in what ways it is different from forested land cover.
You should be aware that hydrographs can be analyzed quantitatively to determine how much of the streamflow is due to storm runoff vs. baseflow. However, that is not something we are going to do in this class.
Natural vs. Channelized Rivers
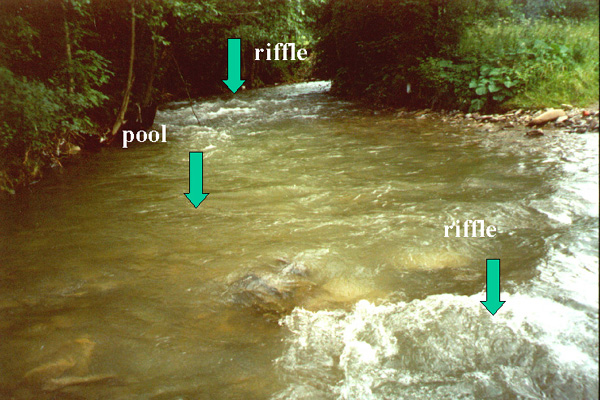
Rivers are naturally constantly changing. Their flow changes in response to weather events and land use changes. They either erode their channels and banks or deposit sediment to create new landforms. Natural rivers tend to be a series of riffles and pools. Riffles are shallow regions covered by stones and gravel where the current moves more quickly and with more turbulence. Pools are slower, calmer and deeper areas with fine-grained bottom deposits. Riffles and pools provide a variety of habitats suitable for different aquatic species. The turbulence in riffles helps hide aquatic animals from predators, provides excellent habitat for aquatic life that can cling to the rocks in the fast moving current, and since the water is well mixed riffles are typically higher in dissolved oxygen than pools. The deepest areas in pools also provide shelter from predators. The slow moving water in pools is necessary for species that are not able to swim in strong currents, and pools tend to be places where organic debris settles out of the water.

In order to drain land for agriculture or building and to make way for roads, historically humans have often straightened (channelized) rivers. This has been done here in Southeastern Florida as much as it has been done anywhere in the world. Although channelization might have some short term benefits, dredging and straightening out river channels eliminates the natural sequence of pools and riffles. Channelization also impedes flooding, which deprives the river’s floodplain of nutrient rich sediments that are valuable for agricultural. Additionally, forcing a river to stay in a single channel limits the amount of erosion the river can do, and therefore deprives downstream areas of a source of sediment. In fact, one of the reasons why New Orleans has so much trouble with flooding is that the flow of the of the Mississippi has been confined to channels limiting its erosion ability. Consequently, the Mississippi delta has been deprived of its long term sediment source. The existing sediments are compacting under their own weight and not enough new sediment is being delivered by the river to keep the delta above sea level.
The Missouri River represents another example of channelization. Read through the following excerpt from a now non-existing USGS website to get a better feel for some of the long term impacts of river channelization.
“GEOGRAPHY
The Missouri River drains one-sixth of the United States and encompasses 529,350 square miles. It flows 2,341 miles from its headwaters at the confluence of the Gallatin, Madison, and Jefferson Rivers in the Rocky Mountains at Three Forks, Montana, to its confluence with the Mississippi River at St. Louis, Missouri.
The basin is home to about 10 million people from 28 Native American tribes, 10 states (Colorado, Iowa, Kansas, Minnesota, Missouri, Montana, Nebraska, North Dakota, South Dakota, Wyoming), and a small part of Canada.
Precipitation in the basin varies from an annual mean of 40 inches in the interior highlands of the Missouri Ozarks to 10 inches in the dry upland plains of North and South Dakota, Wyoming, and Montana. The basin’s elevation drops from 14,000 foot peaks at its northwestern boundary to about 400 feet where it joins the Mississippi.
HISTORY
The pre-development Missouri River represented one of North America’s most diverse ecosystems with abundant braided channels, riparian lands, chutes, sloughs, islands, sandbars, and backwater areas. These riverine and floodplain habitats were created and maintained by erosion and deposition which continuously reshaped the channel and floodplain.The Missouri carried high sediment loads, earning it the nickname “Big Muddy.” …”Today, 35-percent of the Missouri River is impounded, 32-percent has been channelized, and 33-percent is unchannelized…
CHANNELIZATION
Historically, the “Big Muddy” changed course. The channel relocated over 2,000 feet or more a year in some places and deposited huge amounts of silt in other places. It is estimated that 11 billion cubic feet of sediment were carried past St. Charles, Missouri in 1879 — enough to cover a square mile of ground 200 feet deep. Banks along the river would erode 200 to 300 feet during a single rise of the river. It was the movement of this sediment that created braided channels in the meandering river, hampering navigation and the permanency of bottomland farms and river towns.
The Rivers and Harbors Acts of 1912, 1917, 1925, 1927, 1930, 1935, and 1945 each affirmed the desire of the floodplain occupants, the basin’s elected officials, and the federal government to tame the river for navigation, development, and flood control.
The Missouri River Bank Stabilization and Navigation Project created one stabilized channel from the numerous small channels. The plan entailed concentrating the water flow and shaping it in smooth easy bends so that the energy of the flowing water scoured out a deeper, more efficient, navigation channel. Officially completed in 1981, 735 miles of the Missouri River from Sioux City, Iowa, to St. Louis, Missouri have been channelized or stabilized by the plan, allowing urban and agricultural development of the floodplain.
From bluff to bluff, the river-floodplain below Sioux City, Iowa, covers 1.9 million acres. Historically, the river meandered across more than one-fourth of this floodplain acreage. This “meander belt” contained a variety of fish and wildlife habitats including wetlands, sandbars, wet prairies, and bottomland forests. Seasonal floods provided the water needed to replenish shallow-water habitats used for fish and wildlife breeding and growth.
Channelization shortened the river 72 miles, resulting in a loss of 127 miles of river shoreline habitat. Aquatic habitat was lost as 168,000 acres of sediment accreted behind the wing dikes, forming new land. Nearly 354,000 acres of meander belt habitat were lost to urban and agricultural floodplain development. Levees, built to protect against flooding, allowed floodplain property investments. Levees isolated riverine off-channel habitats and wetlands from the river.
The damage to fish and wildlife habitat was acknowledged in 1986 when the Corps was authorized to implement the Missouri River Fish and Wildlife Mitigation Project. The goal of the project is to acquire and restore 28,000 acres in Iowa, Kansas, Missouri, and Nebraska. This equals approximately five-percent of the habitat lost as a result of the Missouri River Bank Stabilization and Navigation Project.”
END OF MODULE 4