6.0 Module Overview and Objectives
Welcome to Module 6
This module contains the following sections:
- 6.1 Introduction to nuclear energy
- 6.2 The pros and cons of nuclear energy
- 6.3 Environmental issues associated with nuclear energy
- 6.4 Thought question
- 6.5 Overview of renewable energy sources
- 6.6 Limitations and drawbacks of renewable energy
Module Objectives (Use these to help guide your studying and note taking.)
By the end of this module you should be able to:
- Compare the pros/cons of nuclear energy with other forms of energy
- Describe the nuclear fuel cycle
- List the 5 countries that generate the most nuclear power
- Describe how spent nuclear fuel rods are typically disposed of in the United States
- Discuss the challenges that the United States is currently facing with regards to disposing of spent nuclear fuel
- Discuss the history and status of Yucca Mountain as a spent nuclear waste repository
- Recognize that technologies exist for recycling spent nuclear fuel
- Define renewable energy
- Compare the amount of renewable energy usage in the United States with usage of non-renewables (both historically and projected into the future)
- Discuss the pros and cons of renewable energy usage
- Describe several environmental consequences of renewable energy use
- Define the following
- Green house gas emissions life cycle analysis
- Energy density
- Fission
- Baseload power
- LLW
- HLW
- Spent nuclear fuel
Module Assignments
Homework 2: Covers modules 4 through 6. See Canvas for details about the homework and the due date.
Modules 4-6 Packback Discussion: See Canvas for due dates. An announcement will be sent out introducing the topic of the discussion.
6.1 Introduction to Nuclear Energy
What is Nuclear Energy?
For a quick introduction to how nuclear power is generated, watch the short YouTube video below and then reflect on the questions listed beneath the video.
Embedded from: https://www.youtube.com/watch?v=MGj_aJz7cTs&index=1&list=PLX6qwYEcvXRkpqdQDXz84F535FDrTS-JD, last accessed 6/4/19.
Questions To Reflect On
1. What is used to turn the turbine in a nuclear power plant?
2. What is the fuel used in nuclear power plants?
3. Discuss the similarities and differences between nuclear power and conventional power.
4. Briefly explain the process that creates the heat used to generate steam in a nuclear power plant.
In addition to the information covered in the video, you should know that…
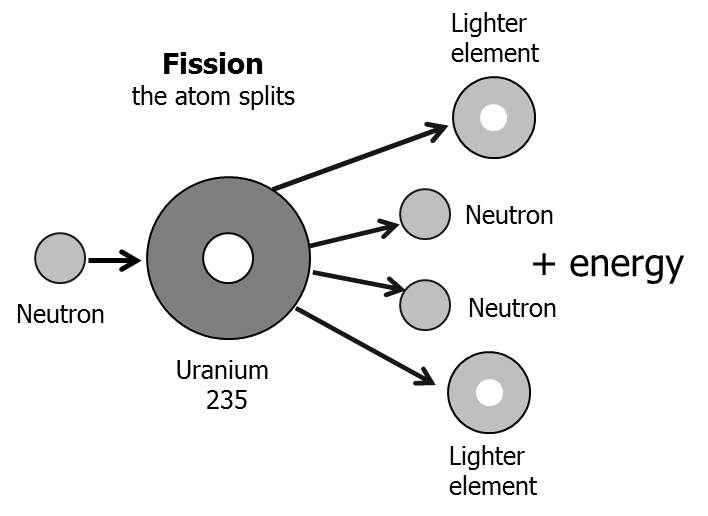
- The process of splitting uranium atoms is called fission.
The Nuclear Fuel Cycle
The environmental issues associated with nuclear power start with mining of the uranium and end with the disposal of the spent fuel from power plants. These collective processes are referred to as the nuclear fuel cycle. To learn about the nuclear fuel cycle, read through the brochure below and then reflect on the questions listed beneath the brochure.
Questions To Reflect On
1. What do the “front end”, “service period”, and “back end” of the nuclear fuel cycle refer to?
2. How does a “once-through” fuel cycle differ from a “closed” fuel cycle?
3. TRUE or FALSE: Uranium is hundreds of times more common than gold.
4. List the three ways to mine uranium.
5. What is the purpose of the uranium milling process?
6. During what step in the nuclear fuel cycle is yellow cake produced?
7. What are the two primary isotopes of uranium? Which isotope is the most abundant? Which isotope is used in nuclear power plants?
8. What is the purpose of the enrichment process in the nuclear fuel cycle?
9. About how long does fuel stay in a nuclear reactor?
10. Where is spent nuclear fuel first stored after it is removed from the reactor?
11. TRUE or FALSE: Spent nuclear fuel can be reprocessed to recover uranium.
Who Uses Nuclear Energy?

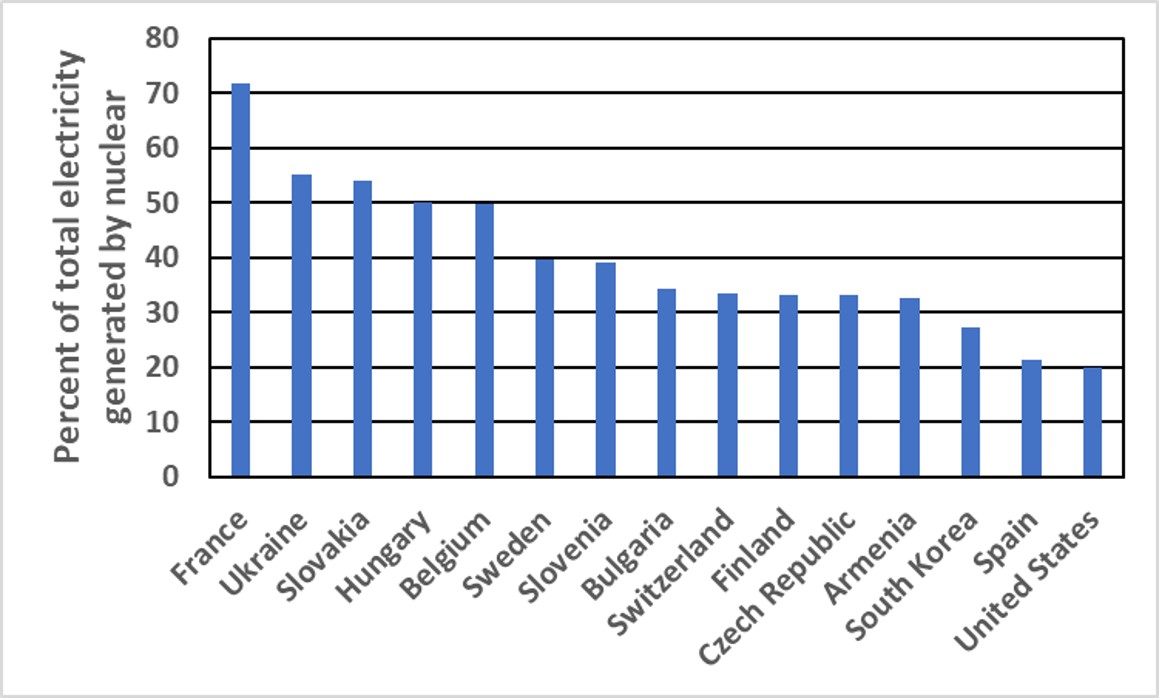
Below are some statistics about nuclear power in the world (data are from the Nuclear Energy Institute and the World Nuclear Association)
As of February 2019…
- 50 countries are operating 450 reactors for energy production.
- About 60 more reactors are being built
- 11% of the world’s energy is produced by nuclear power
- At least 12 countries get at least 25% of their electricity from nuclear power
- France gets about 75% of its electricity from nuclear power
Nuclear Energy in the United States
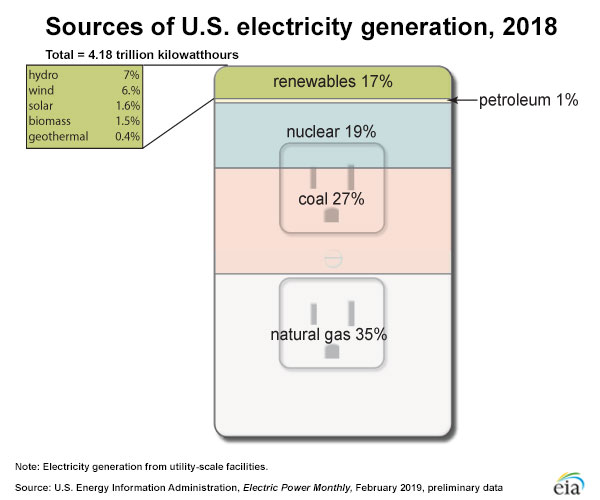
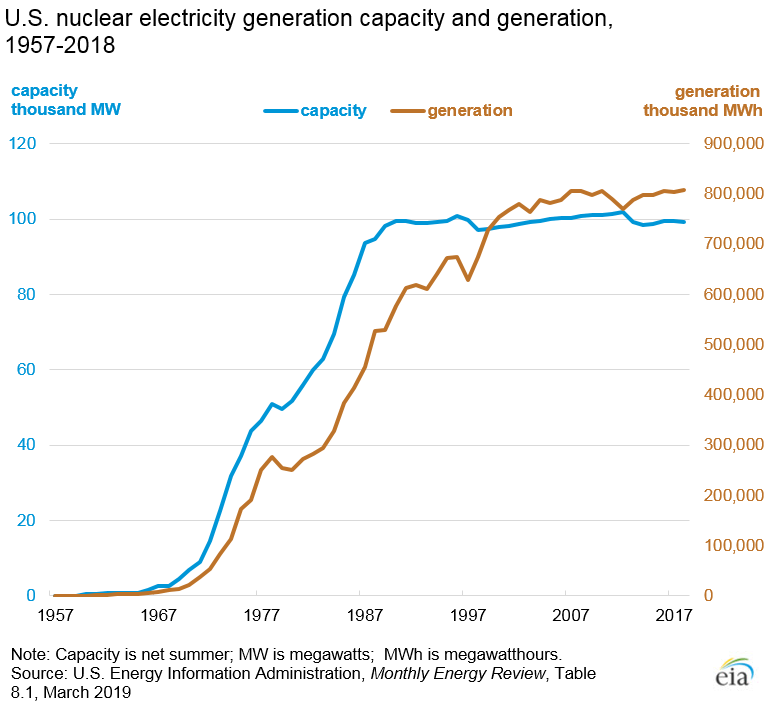
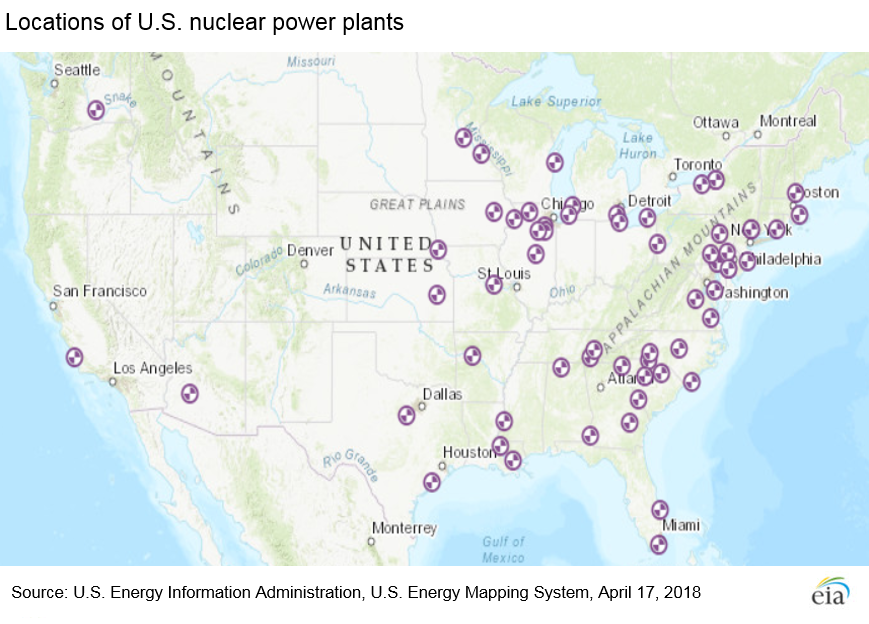
The figures below reveal the following facts about the use of nuclear power in the U.S.
- About 20% of the electricity generated in the United States comes from nuclear power.
- Late last century there was a steady increase in nuclear power generation in the U.S., but in recent years nuclear power generation has been fairly steady in the U.S.
- As of December 2018, there were 60 operating commercial nuclear power plants in the U.S.
- There are 30 states with at least one commercial nuclear power plant.
- The average age of the nuclear reactors in the U.S. is 35 years.
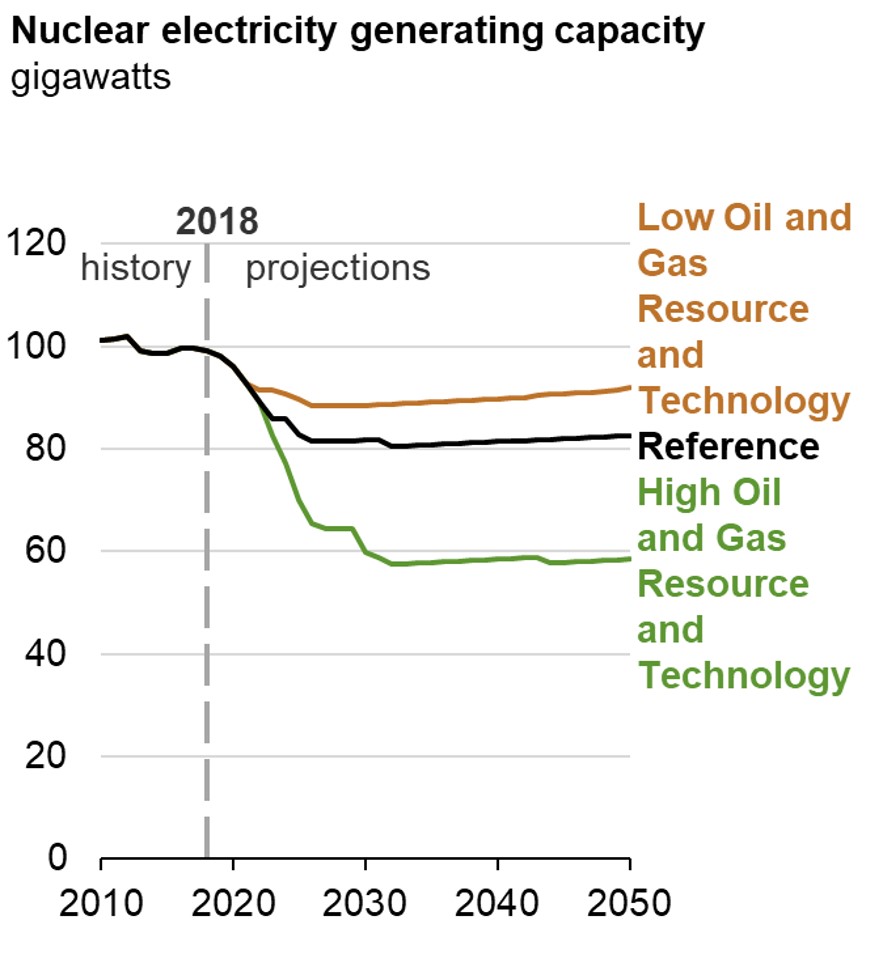
Nuclear power generation in the U.S. is expected to decrease slightly in the coming years.
6.2 The Pros of Nuclear Energy
Nuclear energy has several benefits when compared to fossil fuels…
Energy Density
Energy density refers to the amount of energy storage per mass or volume of a substance. Therefore, it takes a smaller amount of a fuel with a high energy density to provide the same amount of energy from a fuel with a lower energy density.
The primary advantage of fuels with a high energy density is that they require a smaller volume of mining, and therefore the mining operations have a smaller footprint on Earth’s surface.
Uranium has an energy density tens of thousands to hundreds of thousands times greater than that of fossil fuels.
One uranium fuel pellet, approximately the size of the tip of your little finger contains the same amount of energy as…
- 17,000 cubic ft of natural gas
- 1,780 pounds of coal
- 149 gallons of oil
Emissions
Carbon dioxide
Power generation produces greenhouse gas emissions at all steps of the process, including mining and fuel processing, transportation of fuel, power plant construction, power plant operation, and power plant decommissioning. Estimating emissions from all of these different steps is called a life cycle analysis.
Life cycle analyses of different power generation techniques confirm that nuclear and renewable energy sources produce significantly less CO2 than fossil fuels.
“In 2014, the United Nations Intergovernmental Panel on Climate Change found that nuclear power has the lowest lifecycle emissions of any electric power generating technology, except for wind energy.”
Quote from: http://www.nei.org/Issues-Policy/Protecting-the-Environment/Life-Cycle-Emissions-Analyses, last accessed 5/1/16.

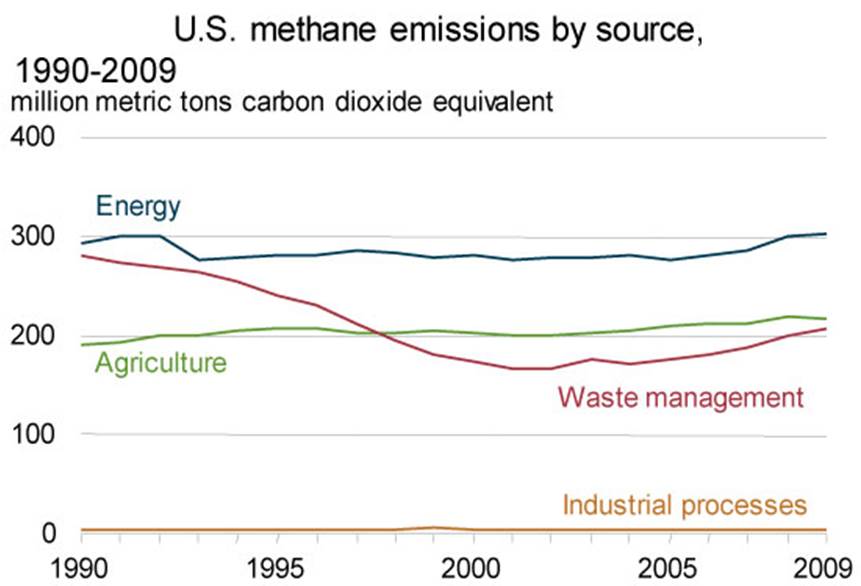
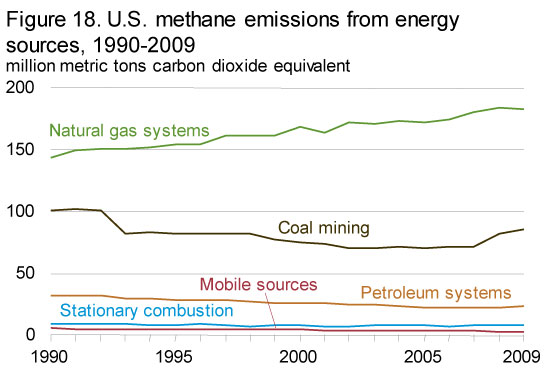
Methane
Methane, CH4, is another powerful greenhouse gas. There are several anthropogenic sources of methane emissions, but energy production produces the most methane of any of these sources, and natural gas and coal are largest sources of methane emissions in the United States. Nuclear power produces essentially no methane.
Air pollutants
Nitrous oxides (NOx) and sulfur oxides (SOx) are air pollutants that contribute to acid rain and ozone pollution and have some negative consequences for human health. Fossil fuel burning, particularly coal, is one of the primary sources of these air pollutants. Nuclear power plants emit essentially no NOx or SOx.
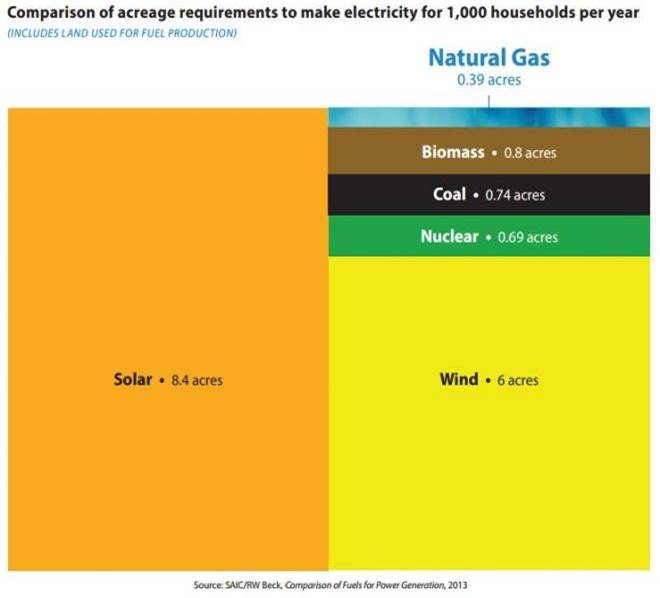
Land Use Footprint
The size of the land area required to generate electricity is another consideration when comparing fuel sources. As you can see from the figures below, nuclear power has a footprint that is on par with that of fossil fuel power plants. However, compared to the other two low carbon energy sources, wind and solar, nuclear has an incredibly small footprint.
Intermittency of Wind and Solar
Power plants fueled by nuclear power and fossil fuels tend to be baseload power sources because they provide power 24 hours a day, 7 days a week. Baseload electricity demand is the minimum demand for electricity over 24 hours. Power plants that are capable of consistently and dependably meeting this demand are called baseload power sources.
Wind, solar, and tidal power, which are some of the other low carbon energy sources besides nuclear, are not baseload power sources because they provide intermittent power. Wind is only capable of generating electricity when the wind blows and solar is only capable of producing power during the day time and when the skies are not cloudy.
One advantage of nuclear power over other low carbon energy sources like wind, solar, and tides is that nuclear power plants generate electricity 24 hours a day, seven days a week. Whereas, wind, solar, and tides produce electricity only intermittently.

6.3 Environmental Issues Associated with Nuclear Power
The Worse Case Scenario – “Nuclear Meltdown”
What is a nuclear meltdown?
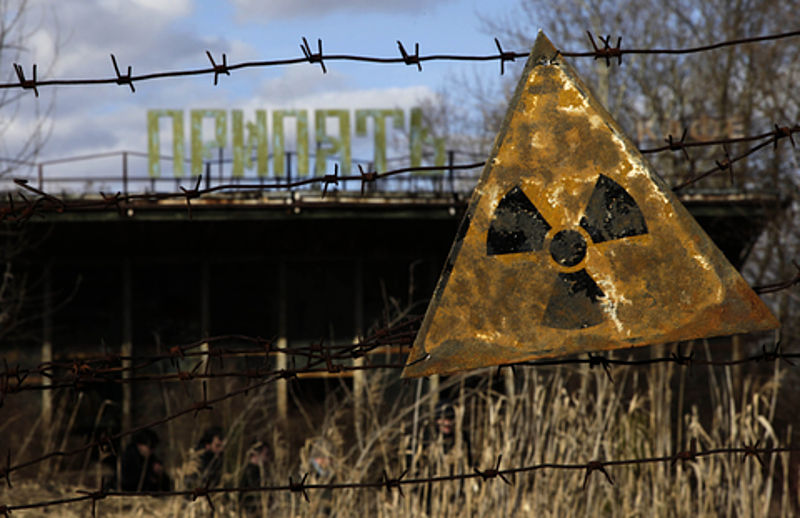
The worst case environmental scenario with nuclear power plants is failure of the containment and safety systems that results in a release of radioactive material. Such catastrophic failures happened at Chernobyl in what was then the Soviet Union in 1986 and in Fukushima, Japan in 2011.
The phrase “nuclear meltdown” is commonly used in reference to Chernobyl and Fukushima. Nuclear meltdown is not a technical term with a precise definition. But we generally use the term to refer to situations where the cooling systems at nuclear power plants fail.
The radioactive processes that happen within a nuclear reactor produce tremendous amounts of heat. That heat is generally controlled by cooling the system with water. When the cooling systems fail, temperatures within the reactor core rise rapidly and the liquid water in the reactor is boiled off as steam leaving the fuel rods exposed to air. When this happens, the fuel rods begin to melt and hot molten uranium begins to pool at the bottom of the reactor core. In a worse case scenario, the hot molten uranium can melt through the steel containment system and other secondary barriers, releasing large amounts of radioactive material to the environment.
The consequences of a nuclear meltdown
Nuclear power plants are highly engineered and heavily regulated with several redundant safety systems in place to prevent catastrophic nuclear accidents. However, as we have learned from events like Chernobyl and Fukushima, these safety measures have not completely eliminated the risk of nuclear accidents. Watch the video and read the articles below to learn about some of the effects of these disasters.
Embedded from: https://www.youtube.com/watch?v=Nf2Yd2kmRvc, last accessed 6/4/19.
Questions to Reflect On
1. TRUE or FALSE: The atmospheric plume of radioactive materials stayed relatively close to the Chernobyl plant.
2. TRUE or FALSE: Even now, thirty years after the disaster at Chernobyl, there is still a large exclusion zone that is considered unsafe for people to live in.
3. What is being built to help contain the radiation while workers remove radioactive materials from what is left of the reactors at Chernobyl?
One of the most significant consequences of nuclear disasters like Chernobyl, Three Mile Island, and Chernobyl is the erosion of public trust in the nuclear power industry. Read through the following about public trust in the aftermath of Fukushima.
Questions to Reflect On
1. How long ago did Fukushima happen?
2. Approximately how many people had to leave their homes as a result of Fukushima?
2. TRUE or FALSE: Testing of food grown/harvested near Fukushima has generally indicated that it is safe to eat.
3. What does the article suggest is one of the primary causes for the lack of public trust in Japan’s nuclear industry?
4. Discuss the issues with groundwater at Fukushima. What is the problem with groundwater at the site? What are they doing with groundwater at the site? What are some of the things being done to try to address the groundwater problems at the site?
Uranium Mining
As with all mining operations, uranium mining presents environmental and health hazards.
- Mining and processing of uranium are energy-intensive processes and produce greenhouse gases
- Habitat is destroyed during mining operations
- Radon, a radioactive gas which is a byproduct of uranium decay, can be released to the atmosphere during uranium mining
- Risk of contamination of groundwater from radon, naturally occurring metals, and chemicals used during in-situ mining operations
- Higher than normal incidence of cancer among uranium mine workers
Radioactive Waste Disposal
In the United States the Nuclear Regulatory Commission (NRC) is the agency that regulates the disposal and storage of radioactive wastes from the nuclear power industry.
There are two broad classifications of radioactive waste that are generated at nuclear power plants.
Low level radioactive wastes (LLW)
- Relatively low levels of radiation
- Typically includes materials that have become contaminated due to exposure to radiation like protective shoe covers, clothing, wiping rags, tools, etc.
- Represent the largest volume of radioactive wastes generated at nuclear power plants
- Stored on site at power plants until radiation levels are low enough to dispose of it with regular waste or until the volume is large enough to ship to a low level waste disposal facility
- There are currently 4 LLW disposal sites in the U.S. that are actively accepting waste
High Level Radioactive Waste
Spent nuclear fuel, which is the used uranium fuel from the reactor
- Thermally very hot
- Maintains deadly levels of radiation for thousands of years
How is spent nuclear fuel dealt with in the U.S.?
When spent fuel rods are removed from a reactor they are placed in temporary storage to allow them cool. Typically the spent fuel goes into steel lined pools filled with 40 ft of water for an initial cooling period. The water acts as both a coolant and as a radiation shield.
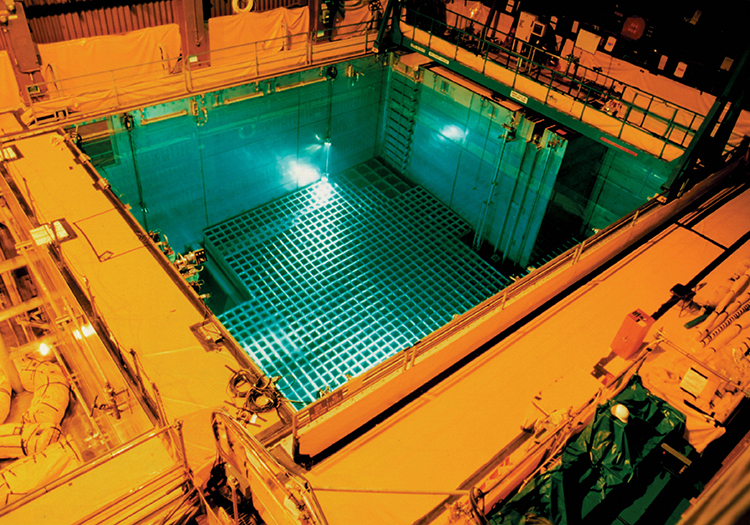
In recent years the U.S. has nearly run out of capacity at its pool storage facilities for spent nuclear fuel. (See figure below.)
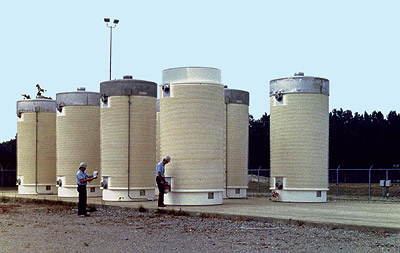
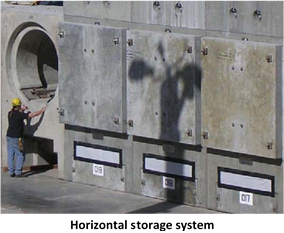
As an alternative to the spent fuel pools, the NRC has approved the practice of moving spent fuel rods out of pools and into dry cask storage after a period of 3 to 10 years once they have undergone their initial cooling period. These casks can then be placed in horizontal or vertical storage systems. Currently there is spent nuclear fuel being stored in dry casks at 59 sites in 34 states.
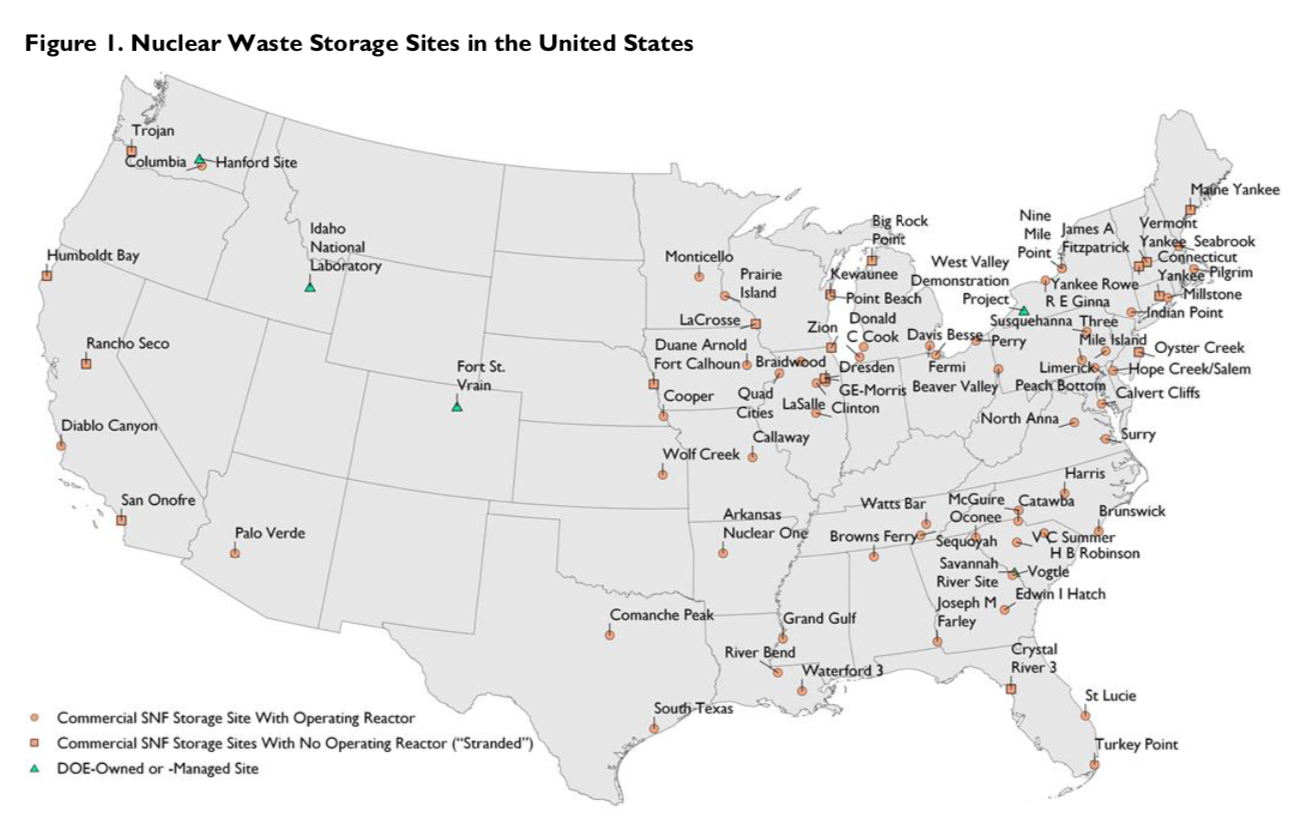
Spent fuel pools and dry cask storage are intended to be temporary and house spent nuclear only until it is safe to move it to a long term central storage facility. However, the United States does not have such a long term central storage facility. Currently HLW is stored in pools or dry casks at dozens of sites scattered around the country.
A long-term solution for safely storing HLW in the U.S. is desperately needed. However, finding such a solution has been fraught with politics and controversy for decades. Below is a very abbreviated timeline summarizing the United States’ efforts to develop a long term solution for the safe storage of spent nuclear fuel.
1982: Congress passed the Nuclear Waste Policy Act (NWPA), which required the U.S. Department of Energy to site, design, and build a long-term repository for high level radioactive waste.
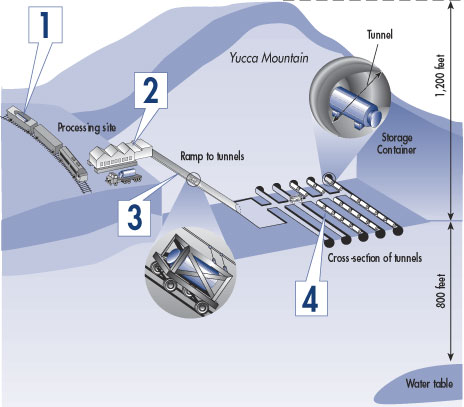
1987: For political and monetary reasons, congress amended the NWPA to limit site characterization to a single site in Nevada called Yucca Mountain.
~1990-~2005: billions of dollars spent characterizing the suitability of Yucca Mountain as a repository and preparing it to receive waste. The studies at Yucca Mountain and their conclusions about the suitability of the site have been the subject of tremendous controversy.
2008: U.S. Department of Energy applied to the Nuclear Regulatory Commission for a license to operate Yucca Mountain as the nation’s radioactive waste repository.
2010: The Obama administration, which was staunchly opposed to Yucca Mountain, ordered the Department of Energy to withdraw its application for a license to operate Yucca Mountain.
2010-2016:
- Essentially no progress on moving forward with Yucca Mountain or any other long term storage solution.
- Spent nuclear fuel remained in pools and dry casks at the surface scattered through the country.
- Energy companies sued the Federal Government for not providing a long term storage solution as required by the NWPA. Courts have awarded the energy companies billions of dollars.
2017 – 2019:
- Donald Trump’s proposed budgets have included money for reviving the approval process for Yucca Mountain, but congress has not approved the funding.
To get a better feel for some of the issues with the long term storage of spent nuclear fuel in the United States, watch the video below and reflect on the questions beneath the video.
Embedded from: https://www.youtube.com/watch?v=tQOHmEeP_Ck, last accessed 5/2/16.
Questions to Reflect On:
1. Where is spent nuclear fuel currently stored in the United States?
2. What are the problems with leaving the spent nuclear fuel where it is currently stored?
3. What is the time frame that spent nuclear fuel remains hazardous?
4. TRUE or FALSE In the 1980s a law was passed requiring the U.S. government to build a central repository for isolate spent nuclear fuel from the environment.
5. Why is the U.S. government reimbursing nuclear power plants for storing spent nuclear fuel on site?
6. What is the name of the site where the US government has proposed building a central repository for spent nuclear fuel and what state is it in?
7. How is France dealing with their spent nuclear fuel?
6.4 Thought Question
Let’s take a break now and answer a thought question poll…
6.5 Overview of Renewable Energy Sources
Renewable energy sources regenerate and can therefore be sustained indefinitely.
There are five major sources of renewable energy.
1. Biomass
- Wood
- Waste to energy (burning garbage to generate electricity)
- Landfill gas
- Ethanol
- Biodiesel
2. Hydropower (dams, tides)
3. Geothermal
4. Wind
5. Solar
What Are The Benefits of Renewable Energy Sources
Each of the above energy sources has its own benefits and drawbacks. The following article provides a nice summary of some of the benefits of renewable energy. Click on the button below, read through the article, and reflect on the questions listed beneath the article.
Questions to Reflect On
1. TRUE or FALSE: All renewable energy sources have low CO2 emissions.
2. The National Renewable Energy Laboratory estimated that if the United States were to generate 80 percent of its electricity from renewable sources by 2050, U.S. emissions of greenhouse gases could be reduced by ____________ percent.
3. Discuss how switching from fossil fuels to renewables can benefit public health.
4. How do the water needs of wind and solar energy compare to those of fossil fuel driven power plants.
5. TRUE or FALSE: According to the article, more jobs are created from generating electricity with fossil fuels than from generating electricity with renewable sources.
6. Which has a more stable long term cost, fossil fuels or renewable energy sources?
7. What does the article mean when it refers to a distributed system? What is the advantage of having a distributed system?
7. What does the article mean when it refers to a modular system? What is the advantage of a modular system?
How Much Renewable Energy do we Use?
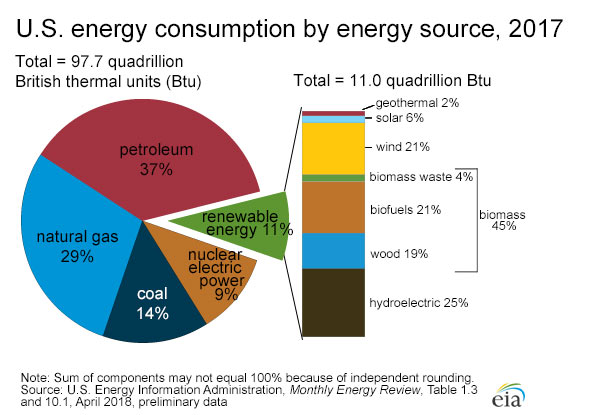
In the United States, approximately 11% of our energy use is supplied by renewable energy sources.
Hydroelectric, wind, and biofuels are the largest sources of renewable energy in the U.S.
Globally, the picture is not much different with about 11% of global energy consumption supplied by renewable energy resources. The U.S. Energy Information Agency estimates that by 2040 about 15% of global energy consumption will come from renewable resources.
6.6 Limitations and Drawbacks of Renewable Energy Sources
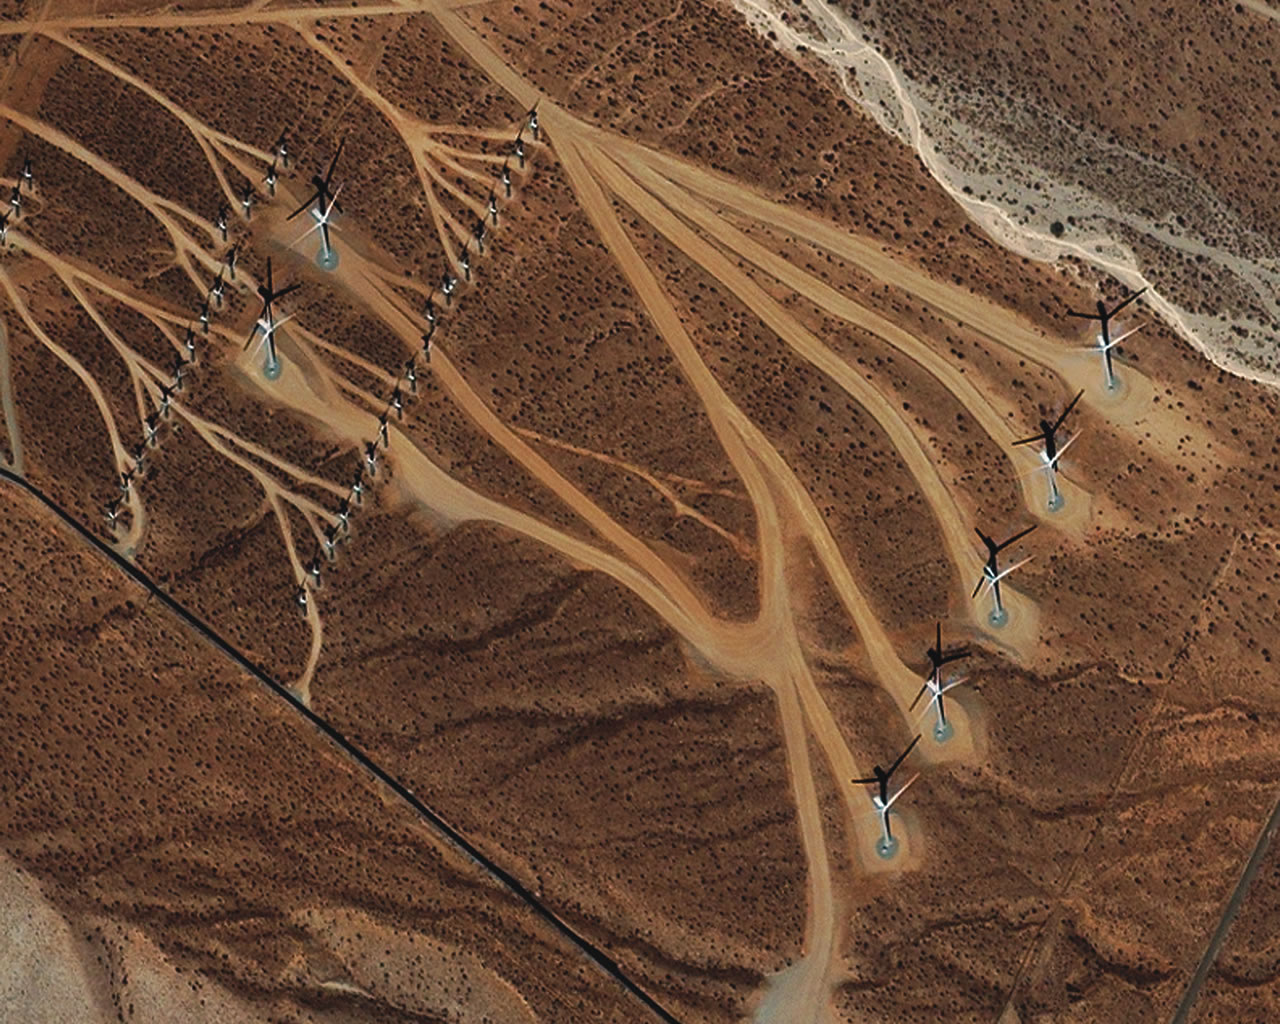
Wind
- Cost. Although the cost of wind power has declined, it still requires a significantly higher investment than fossil fuel plants. Depending on how much energy a wind site produces, it might not be cost-competitive with a fossil fuel plant.
- Location. The best sites for wind farms are often located in remote areas far away from cities where the electricity is needed. Therefore expansion of the use of wind power also requires expansion of power transmission lines.
- Competition for land use. Land used for wind farms might also be suitable for agriculture or urban/suburban development, and construction of wind farms might not be the most profitable use of the land.
- Noise pollution and visual disturbances. Wind farms can be a source of noise pollution and can be visually unsightly.
- Wildlife harm. Bird kills due to birds flying into the turbine blades has been a problem at wind farms. Careful siting of wind farms and some technological advances have helped to reduce this.
- Intermittent. The wind does not blow 24/7. So wind is an intermittent power source.
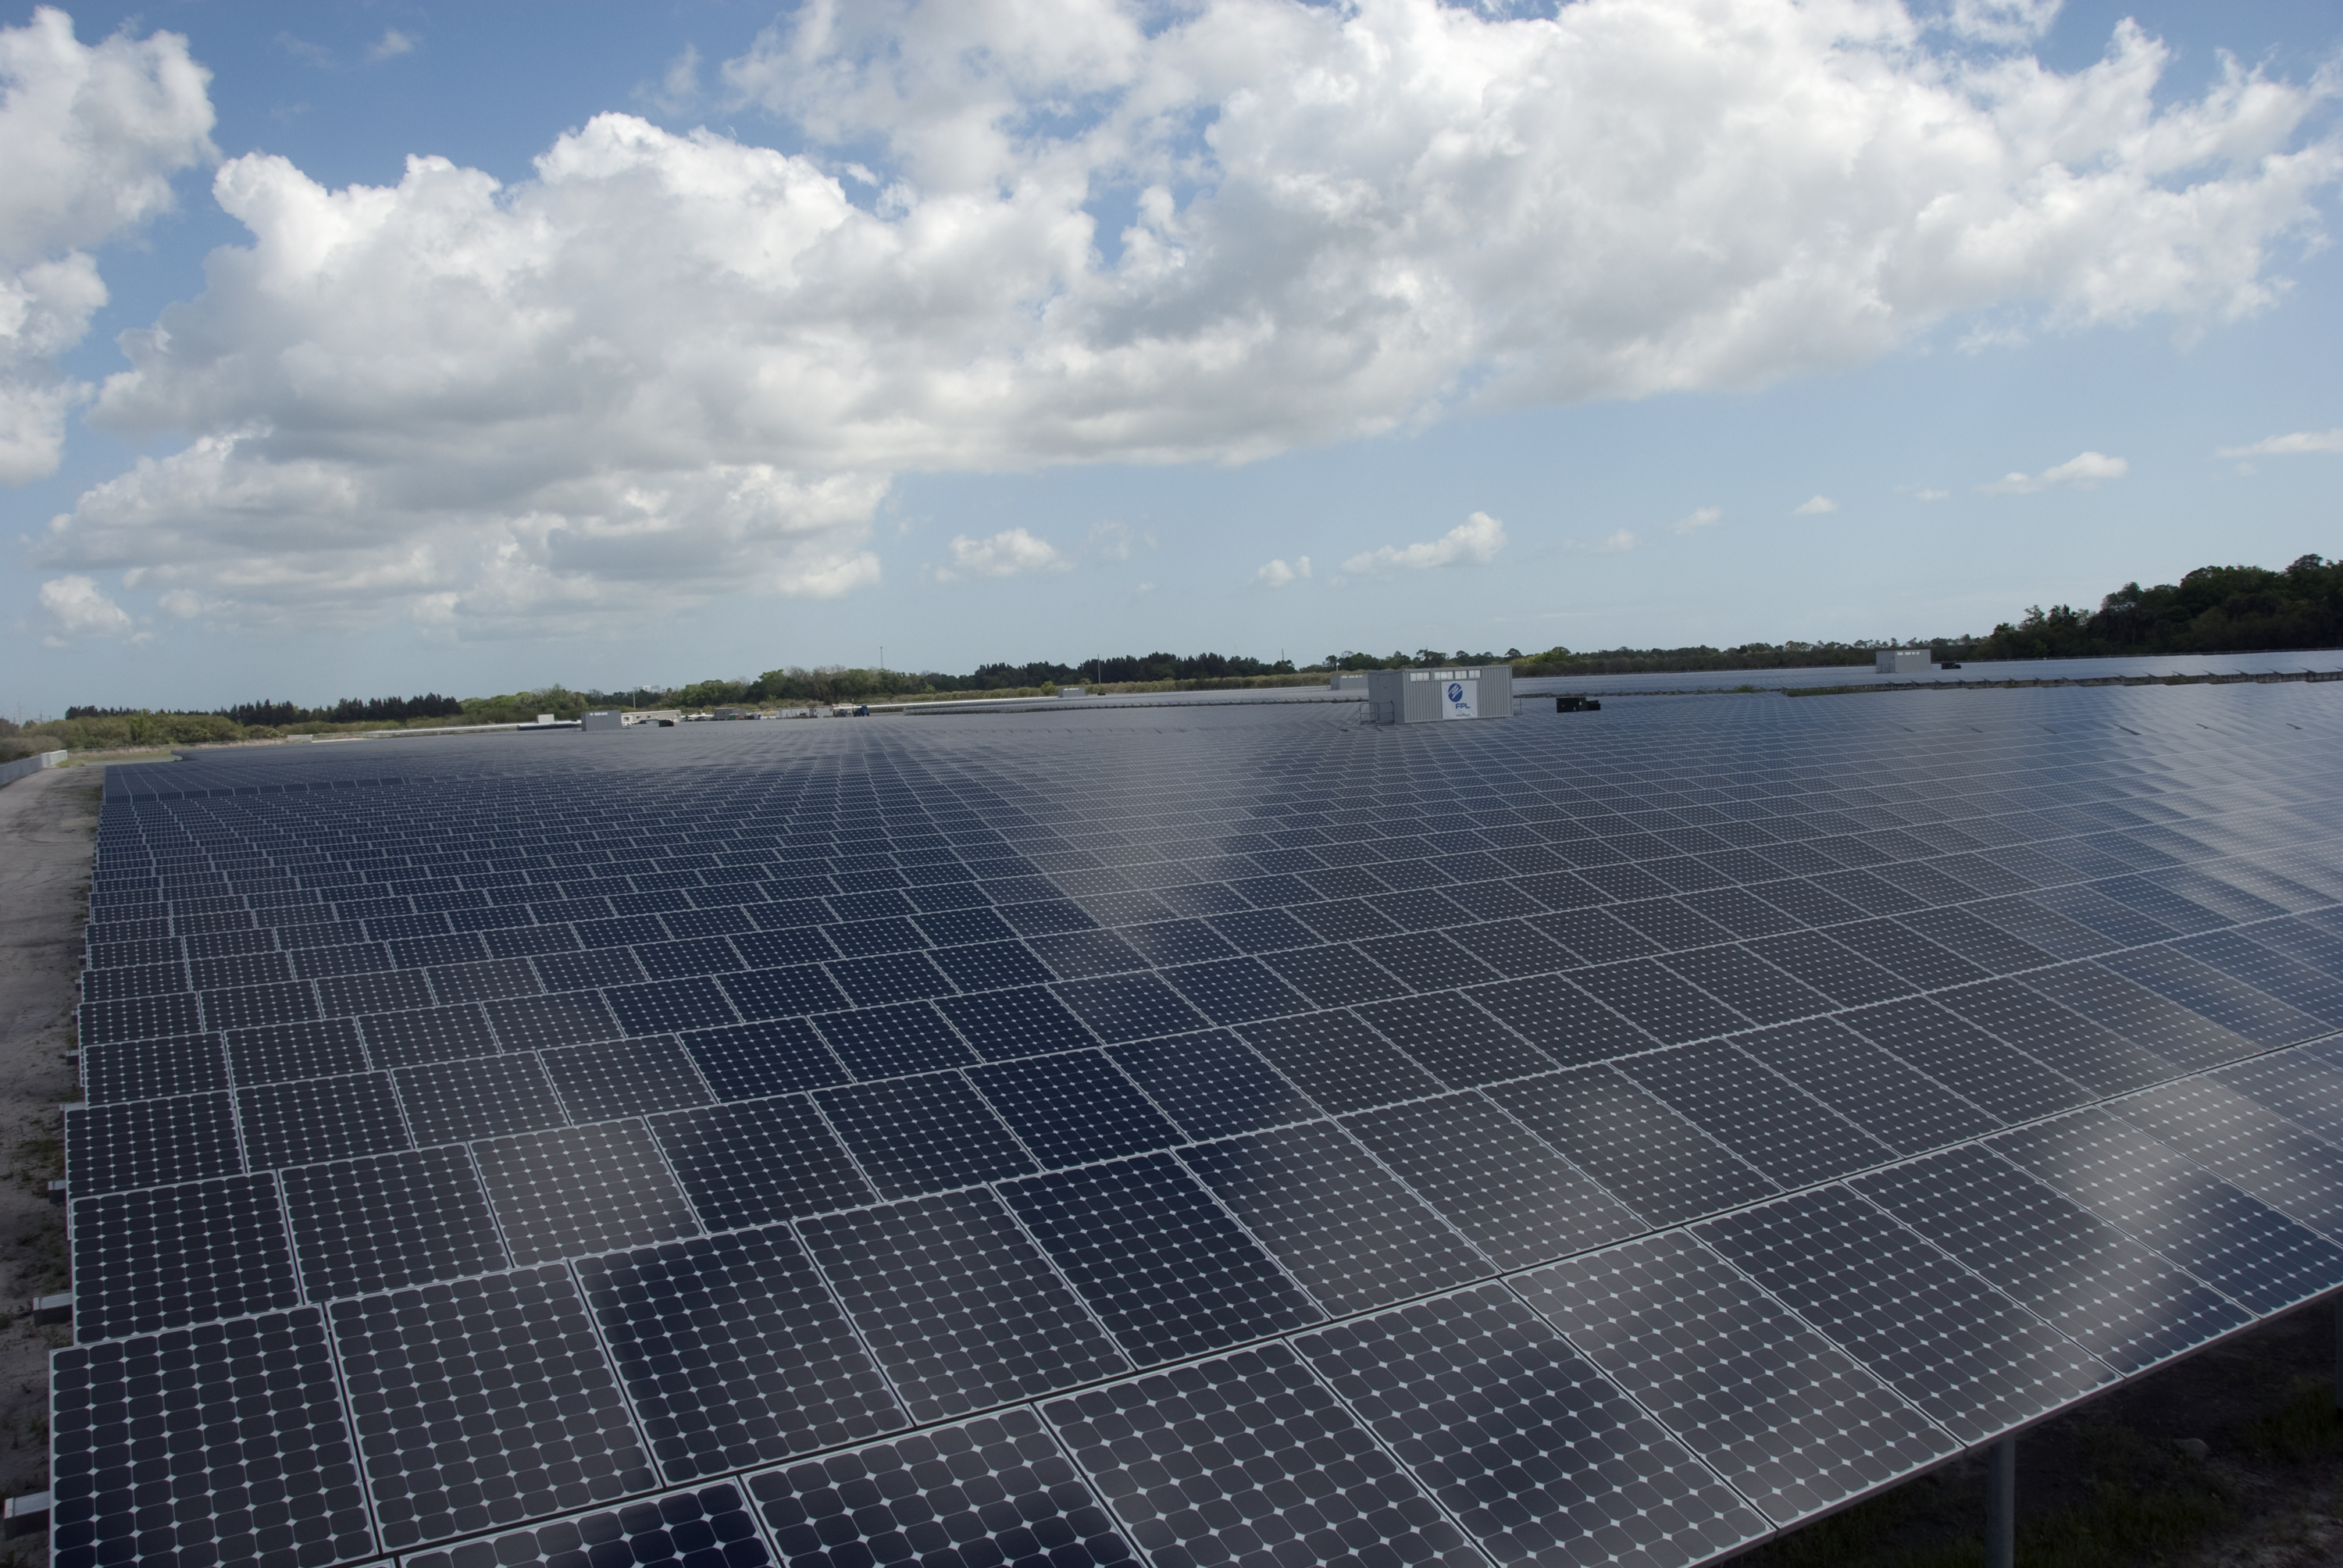
Solar
- Cost. As with wind turbines, the initial cost of installing solar panels can be high.
- Location. Solar panels are not effective in regions that are often cloudy or locally in areas that are shaded.
- Intermittent. The sun does not shine 24/7. So solar energy is an intermittent power source.
- Pollution. The manufacturing of solar panels generates a significant amount of toxic waste and requires energy that is typically obtained from “dirty” fossil fuels.
- Large footprint. For applications beyond supplying a single household with electricity, solar panels need to cover a large area in order to produce adequate electricity.
Biomass
Biofuels
- Cost. The production costs of biofuels is quite high compared the production costs of regular gasoline.
- Monocropping. Biofuels provide economic incentive for farmers to grow a single plant year after year, but this has negative consequences for soil health and for biodiversity.
- Pollution. Growing of crops for biofuels requires fertilizers and possibly pesticides which are common sources of water pollution. Additional, the production of biofuels from plants is energy intensive and is typically fueled by “dirty” fossil fuels.
- Competition with food crops. The land used to grow crops for biofuels is land that could be used to grow food crops.
- Water use. Large quantities of water are necessary to irrigate the crops used for biofuels.
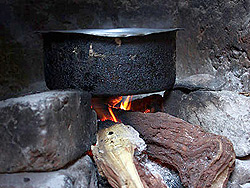
Biomass Burning
Wood, dung, and charcoal
Nearly 3 billion people, mostly in developing countries rely on open fires for cooking and heating. This leads to several environmental and human health consequences.
- It is estimated that annually 4 million people die premature deaths attributable indoor air pollution from cooking by burning biomass.
- Over 50% of premature deaths due to pneumonia in children under 5 are caused by indoor air pollution.
- Biomass burning emits large amounts of greenhouse gases.
- Some areas are being over forested to obtain wood for fuel.
Hydropower
- Displacement of people. Depending on where dams are built, large numbers of people who were living in the flooded zone become displaced.
- Loss of habitat. When dams are built, large areas become flooded destroying the native habitat.
- Human health. There are a lot of issues with human health and dams. Dams create stagnant areas of water which become breading grounds for mosquitos and parasites that pose a threat to human health. Also, in developing countries the reservoirs created by dams tend to become dumping grounds for waste as well as supplies for drinking water, cooking water, and cleaning water. This kind of multi-use exposes people to contaminants.
- Impediment to fish migration.
- Downstream impacts. Dams block sediment and nutrients that otherwise would travel downstream. Thus many areas downstream of dams suffer a loss of soil quality.
- Greenhouse gas emissions. It seems like hydropower should be an emissions free source of electricity. However, when an area is flooded all of the organic matter that is now under water decays, and this decay process produces methane, a powerful greenhouse gas.
END OF MODULE 6