5.0 Module Overview and Objectives
Welcome to Module 5
This module contains the following sections:
- 5.1 Overview of hydraulic fracturing
- 5.2 Environmental impacts of hydraulic fracturing
- 5.3 Tar sands
Module Objectives (Use these to help guide your studying and note taking.)
By the end of this module you should be able to:
- Describe shale gas and explain how it differs from conventional gas.
- Define tight sand gas and tight oil.
- Discuss how fracking has impacted natural gas production by source.
- Describe the process of hydraulic fracturing.
- Discuss the rapid increase in the number of wells and fracking operations and the risks associated with that.
- Discuss the advantages of gas over coal.
- Summarize the environmental concerns associated with hydraulic fracturing.
- Describe tar sands and identify where they occur.
- Briefly describe how petroleum is produced from tar sands.
- Discuss the environmental concerns associated with oil production from tar sands.
- Discuss the current status of fracking in Florida.
Module Assignments
Quiz 2: See Canvas for details about the quiz and the timeframe when the quiz will be open for you to take.
5.1 Overview of Hydraulic Fracturing
To get us started learning about hydraulic fracturing, take a look at the below diagram and definitions and familiarize yourself with the terms.
What Are Tight Oil and Gas Reserves?
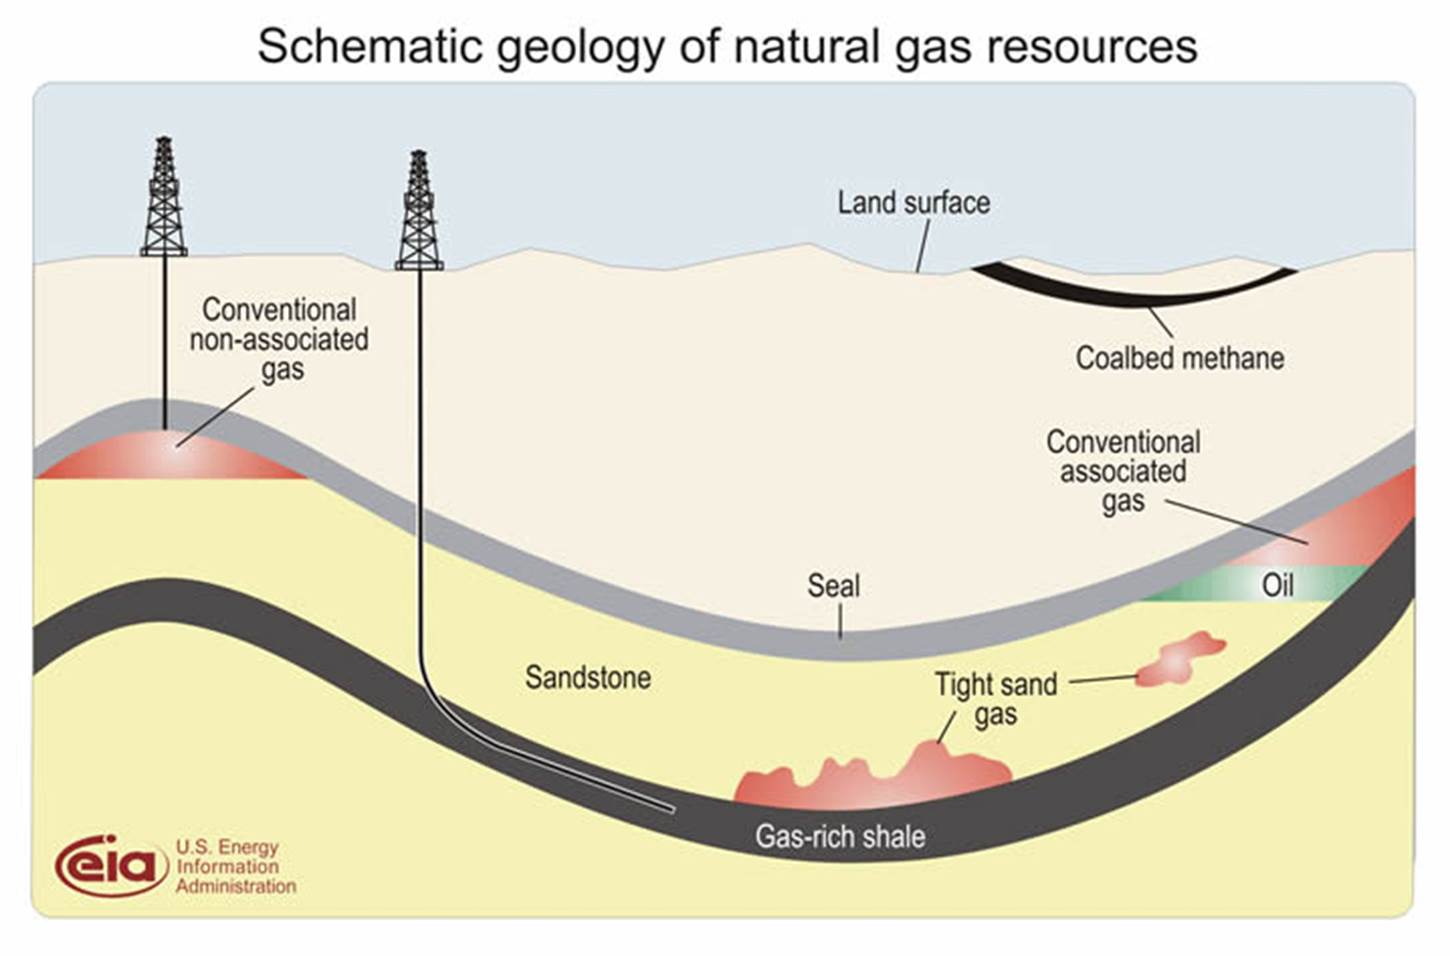
Permeability: describes how easy it is for a gas or liquid to flow through rock. The higher the permeability, the easier it is for the gas or liquid to flow.
Gas-Rich Shale: the source rock for many natural gas resources. Until recently when horizontal drilling and hydraulic fracturing have become more affordable, it has not been economical to produce shale gas resources.
Conventional gas occurs when gas migrates from shale (a rock with low permeability) into an overlying sandstone that has a relatively high permeability.
Tight sand gas: gas that migrates from source shale into a low permeability sandstone.
Tight oil: tight oil is liquid petroleum that is present in low permeability sands.
Hydraulic fracturing technology can be used to produce both gas and liquid petroleum associated with tight sands and shales.
What is Hydraulic Fracturing?
Watch the video below to learn about the steps involved in hydraulic fracturing. Note that the video was made by Marathon Oil, so it is definitely presented from the industry’s perspective. However, the schematics and visuals provide a very nice overview of the general processes used in hydraulic fracturing.
Embedded from: https://www.youtube.com/watch?v=VY34PQUiwOQ, last accessed 4/25/16.
Questions to reflect on:
- Roughly how deep are most shale reservoirs?
- Where are shale reservoirs located relative to fresh water aquifers used for drinking water?
- What makes drilling for hydrocarbons in a shale formation unique?
- What are the primary purposes of the chemicals that are added to fracking fluid?
- What is the purpose of the sand in the fracking fluid?
- Briefly describe what is done with the well and surrounding land after the well has stopped producing.
What Does Oil Shale Look Like?
The shale that is being “fracked” is thousands of feet deep, but in some places shale is present at the surface as outcrops. Scroll through the slide show below to get a feel for what shale looks like.
-
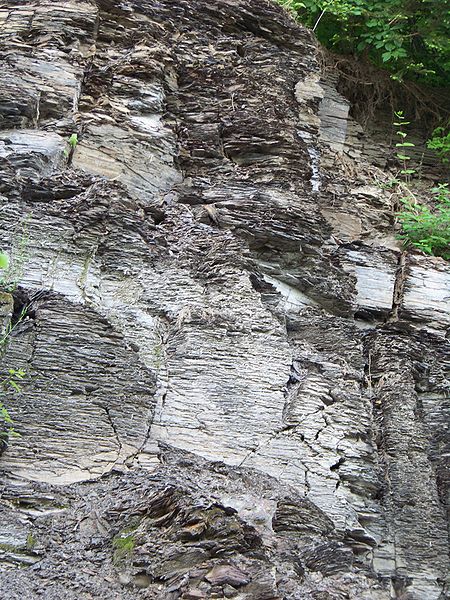
Marcellus shale outcrop, New York. Licensed under the Creative Commons Attribution-Share Alike 3.0 Unported license. Retrieved from https://en.wikipedia.org/wiki/Marcellus_Formation, 4/23/16. -
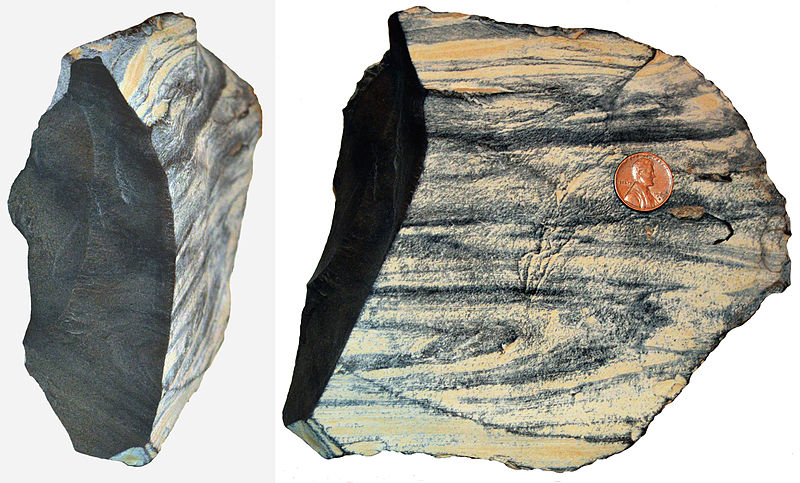
Green River oil shale, Colorado. Licensed under the Creative Commons Attribution-Share Alike 3.0 Unported license. Retrieved from https://en.wikipedia.org/wiki/Oil_shale_geology, 4/23/16. -

Marcellus shale outcrop, Pennsylvania. Retrieved from: http://energy.gov/fe/shale-reservoir-characterization, last accessed 4/23/16. -
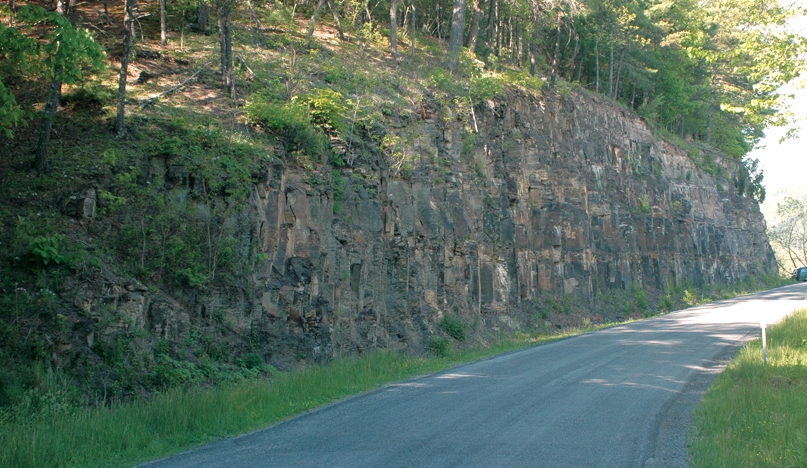
Marcellus shale outcrop, Virginia. Photo taken by James Coleman. Image in the public domain. Retrieved from: http://gallery.usgs.gov/photos/10_12_2012_y1v2YLk88S_10_12_2012_0#.Vx5tIFQmySo, last accessed 4/23/16.
Where Is Hydraulic Fracturing Occurring?
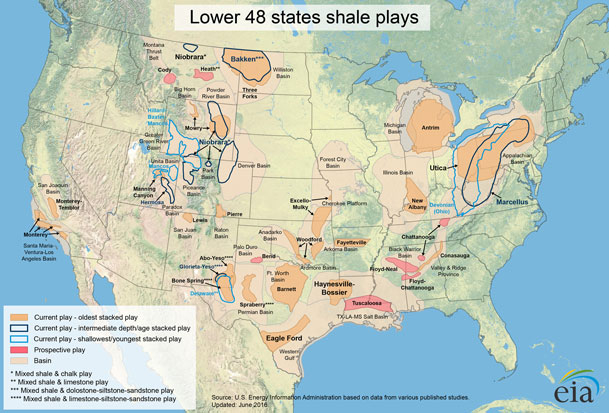
The majority of hydraulic fracturing is being done in the United States. Canada and Argentina are among the other countries doing hydraulic fracturing. There are several locations throughout the United States where hydraulic fracturing is occurring. The majority of fracking in the U.S. is being done in the Marcellus shale in Pennsylvania, West Virginia, Ohio, and New York. There is also significant production from the Haynesville (LA and TX), the Utica (OH), the Permian (TX and NM), the Eagle Ford (TX), and the Haynesville shale (LA and TX).
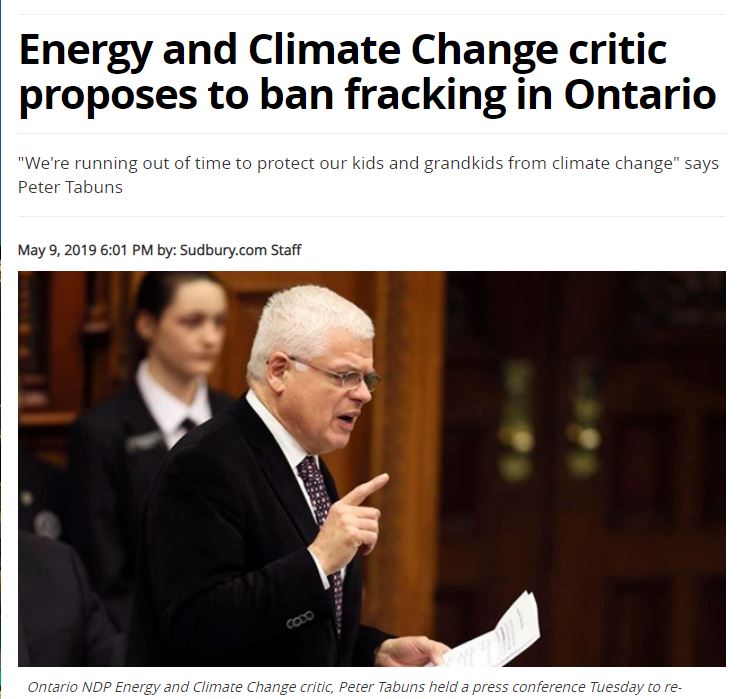
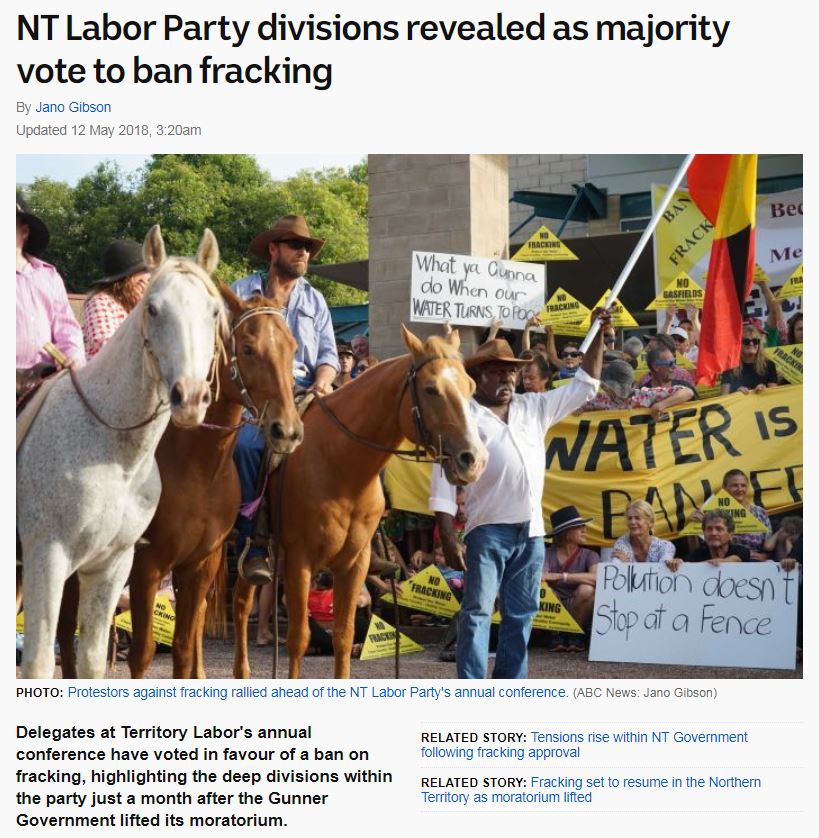
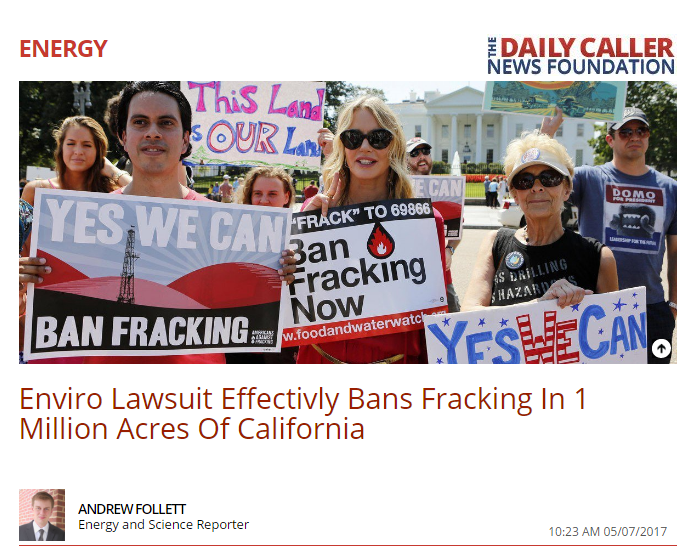
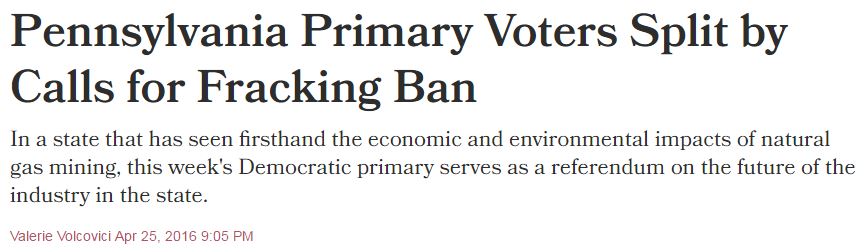
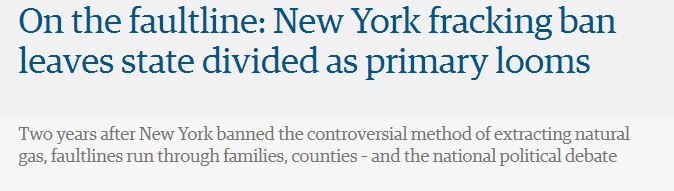
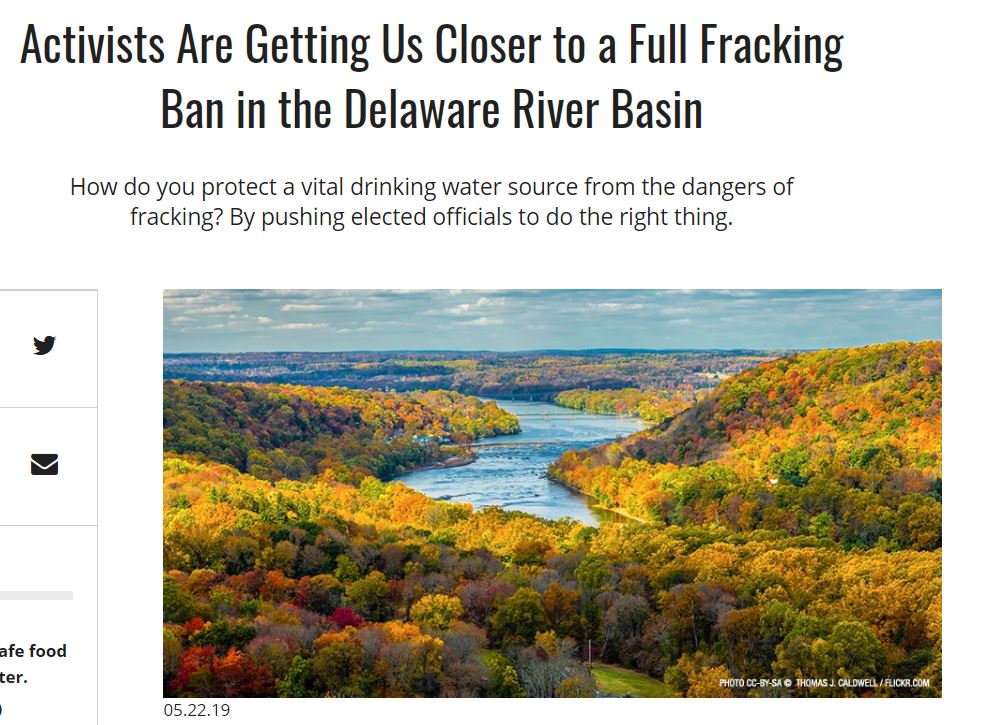
Ireland, Uruguay, Germany, France, Scotland, Spain, Romania, and Bulgaria have all implemented bans on fracking. Some of these bans are nation-wide and others are just in local areas. Within the United States there are several ongoing heated debates about implementing fracking bans. (Scroll through the slide show below to see recent headlines about fracking bans.)
-

https://truthout.org/articles/as-washington-state-bans-fracking-sanders-calls-for-nationwide-ban/
-
-
-
-
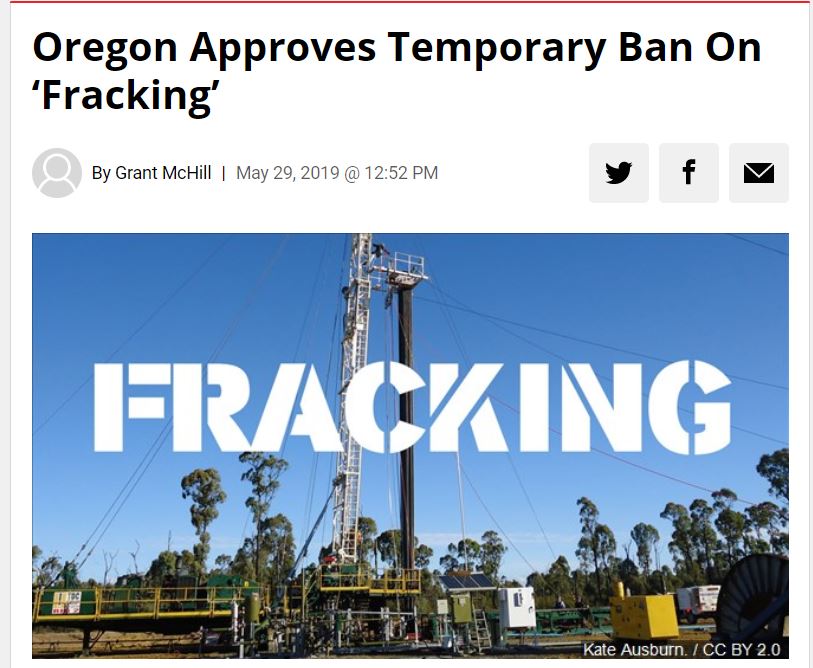
https://www.kxl.com/oregon-approves-temporary-ban-on-fracking/
-
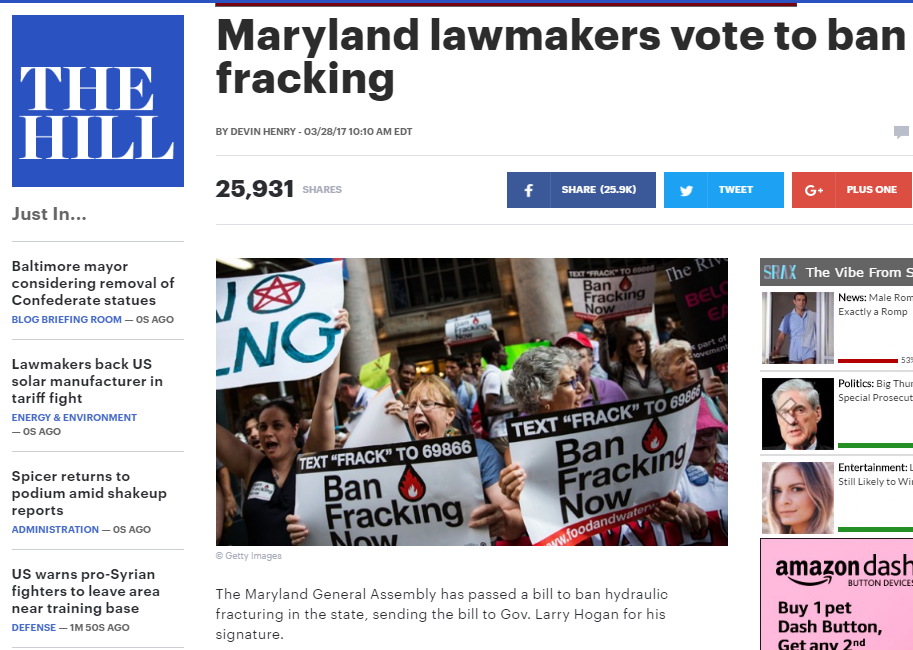
http://thehill.com/policy/energy-environment/326078-maryland-lawmakers-vote-to-ban-fracking
-
http://www.haaretz.com/world-news/u-s-election-2016/1.716352
-
http://www.bbc.com/news/uk-scotland-scotland-politics-44035177http://www.theguardian.com/environment/2016/apr/16/fracking-new-york-primary-bernie-sanders-hillary-clinton-donald-trump
-
Although there is very little natural gas produced in Florida, over last couple of years, fracking bans have been considered by the state legislature. Bills have been introduced that would ban fracking until its potential effects on the state could be studied. In the spring 2018 legislative session, such a bill was passed by a Senate subcommittee but did not get considered by the House.
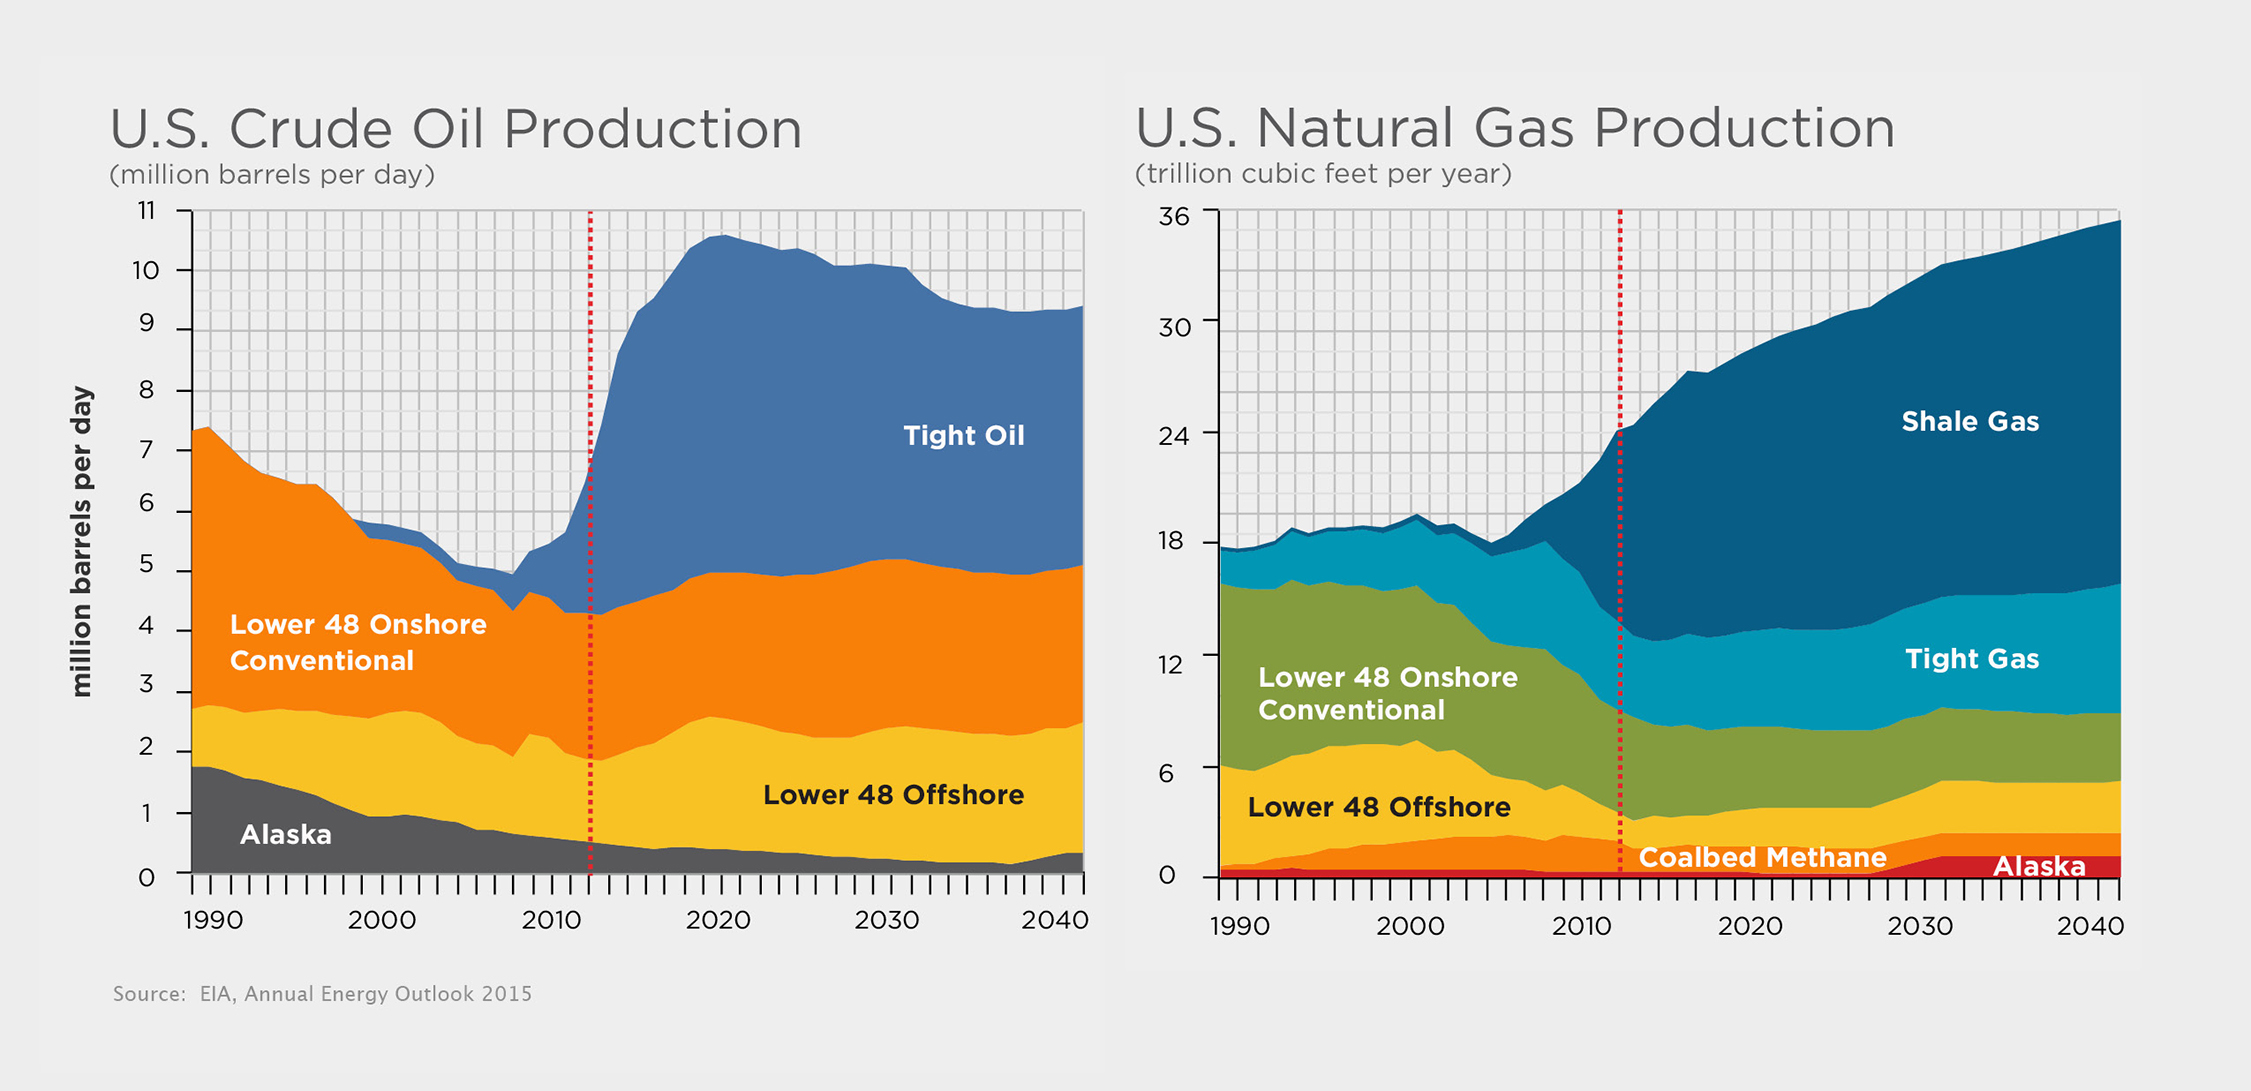
How Much Hydraulic Fracturing is Being Done?
On the graphs below, note the rapid increase in U.S. production of tight oil and shale gas beginning around 2009. This rapid increase was due to the fracking boom.
To get a feel for the pace at which hydraulic fracturing in recent years, check out the videos below.
Embedded from: https://www.youtube.com/watch?v=LPfGoNvsqt0, last accessed 4/26/16.
Embedded from: https://www.youtube.com/watch?v=rOaZw_es-80, last accessed 4/26/16.
Benefits of Hydraulic Fracturing
Benefits of Natural Gas in General
- Cheaper fuel source than coal
- Fewer carbon dioxide emissions than coal
- Fewer emissions of air pollutants, like nitrous and sulfur oxides, than coal
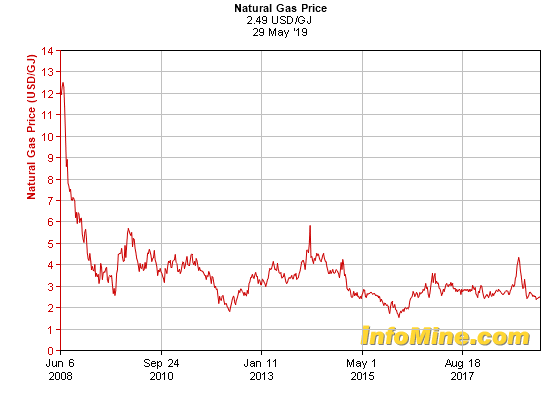
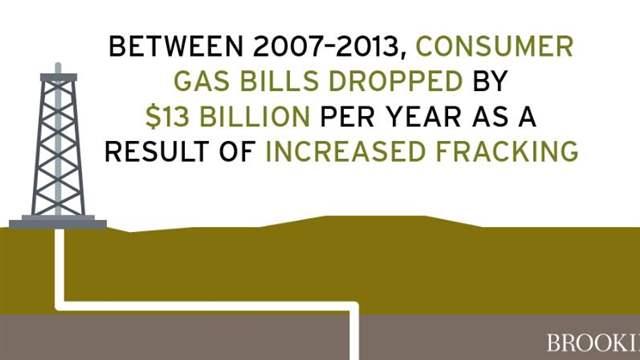
- Lower natural gas prices which are resulting in savings to consumers. (See figures below.)
- Benefits to local economies as new fracking activity creates jobs. However, this also has a down side as towns grown to support the fracking activities and then suffer economic hardship when the fracking ends.
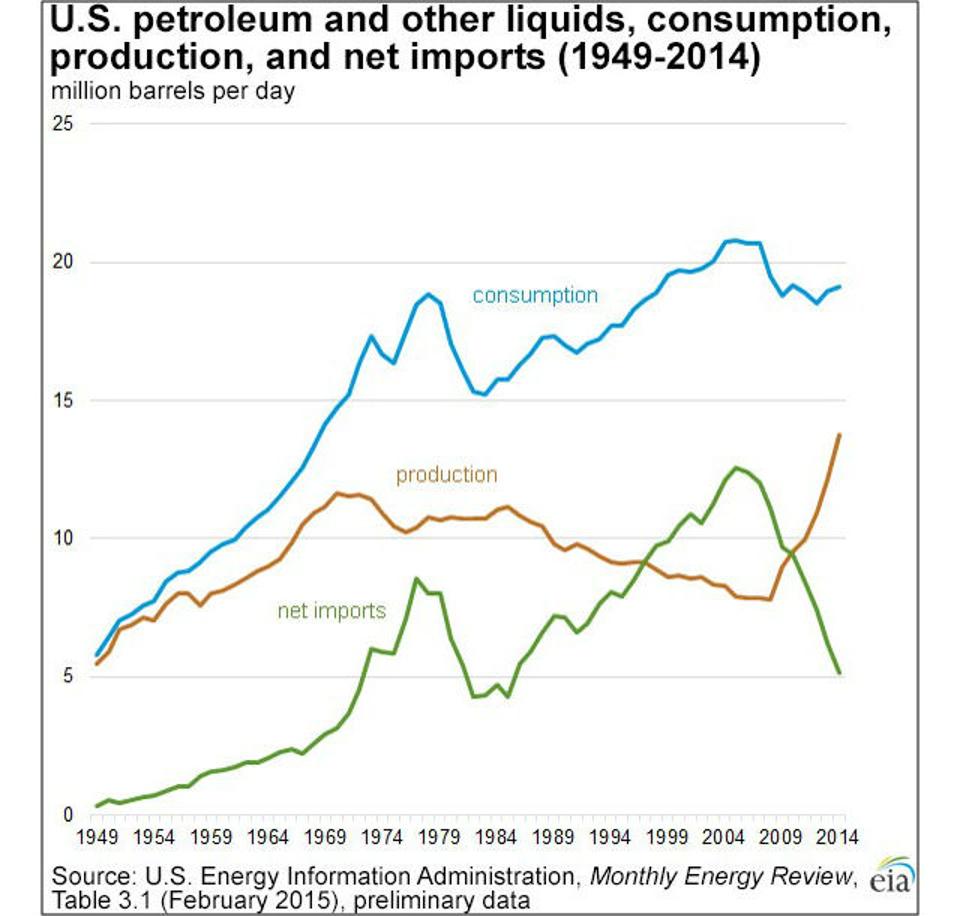
- Decreased dependency on foreign oil. (See the article and graph below and reflect on the questions beneath the graph.)
U.S. Dependence On Foreign Oil Hits 30-Year Low
FORBES
APR 20, 2016 @ 04:55 PM
Mike Patton, Contributor
If you were driving during the 1970s, do you remember waiting in line for an hour or more just to put gas in the ol’ car? Thanks to the OPEC oil embargo, petroleum was in short supply. At that time, America’s need for crude oil was soaring while U.S. production was falling. As a result, the U.S. was becoming increasingly dependent on foreign suppliers. Things have changed quite a lot since then. Beginning in the mid-2000s, America’s dependence on foreign oil began to decline. In this article, we will discuss how America’s production, consumption, and dependence on foreign supply have changed since 1949.
Petroleum: Black Gold
Without petroleum, societal comforts would regress over 100 years. Whether you are a fan or foe, petroleum is a relatively inexpensive source of energy and widely used. In 2014, Americans consumed about 375 million gallons of gasoline per day. This represented approximately 47% of total domestic petroleum consumption. Which states used the most gasoline? California topped the list, consuming over 37 million gallons per day or 11% of total U.S. consumption. Texas was a close second, using more than 36 million gallons per day or 10% of the total; followed by Florida (6%); New York (4%); and finally, Ohio (4%).
Worldwide consumption of petroleum liquids in 2013 was 91.2 million barrels per day with the U.S. consuming the most (21% of the total). The most populous nation on Earth, China, consumed 11% and the tiny island of Japan used 5%. Conversely, the top three oil-producing countries from 1995 through 2014 were the same. They simply traded places. They were the U.S. Russia, and Saudi Arabia.
America’s Petroleum Independence
Currently, the U.S. is much less dependent on foreign supply than it was a decade ago. The following chart shows how U.S. production, consumption, and net petroleum imports have changed since 1949. Notice how net imports began to fall in the mid-2000s (green line), while consumption was flat (blue line). Around 2009, U.S. petroleum production began to rise as new technology provided innovative extraction methods. In short, the U.S. shale oil boom was a major force. However, collapsing prices led to numerous bankruptcies and fewer drillers. It’s noteworthy that the period covered in the chart includes the peak in oil prices, which occurred in June 2014, and its subsequent decline. From its peak in June to the end of the year, the price of crude fell 50%. For the entire year, oil prices declined 45.6%. The following year (2015), prices decreased over 30%.
Despite the collapse in price, U.S. dependence on foreign oil should continue to decrease. Moreover, petroleum products will continue to play the lead role in America’s energy consumption through 2040, according to the U.S. Energy Information Administration. The EIA will release its next Annual Energy Outlook in June 2016. We will check back then for an update.
Questions to Reflect On
- When did the United State’s dependency on foreign oil begin to decline?
- Reflecting back to the last module, what do you think might have contributed to the flattening out of the consumption curve in the late 1900’s?
- When did US production begin to increase? What was the main cause of this increase?
- According to the article, when did oil prices peak? What caused oil prices to start to fall? How did the drop in oil prices impact drillers?
5.2 Environmental Impacts of Hydraulic Fracturing
Water use
All methods of gas and petroleum production, including fracking, require large volumes of water. Because this water use competes with the water needs of humans and the environment, it is often pointed to as one of the significant environmental impacts of fracking.
Until recently, it had been argued that the amount of water used for fracking was a relatively small percentage of our overall water use. The argument was that, although water use for fracking could have some impacts on local water supplies, compared to things like agricultural water use, fracking water use was minimal. However, recent research has shown that over time that amount of water used in fracking has skyrocketed and that this water use could contribute to water shortages, particularly in arid regions. Read through the article below for more details.
WATER USE FOR FRACKING HAS RISEN BY UP TO 770 PERCENT SINCE 2011August 15, 2018
Contact: Tim Lucas (919) 613-8084 tdlucas@duke.edu
DURHAM, N.C. — The amount of water used per well for hydraulic fracturing surged by up to 770 percent between 2011 and 2016 in all major U.S. shale gas and oil production regions, a new Duke University study finds.
The volume of brine-laden wastewater that fracked oil and gas wells generated during their first year of production also increased by up to 1440 percent during the same period, the study shows.
If this rapid intensification continues, fracking’s water footprint could grow by up to 50-fold in some regions by the year 2030 — raising concerns about its sustainability, particularly in arid or semi-arid regions in western states, or other areas where groundwater supplies are stressed or limited. “Previous studies suggested hydraulic fracturing does not use significantly more water than other energy sources, but those findings were based only on aggregated data from the early years of fracking,” said Avner Vengosh, professor of geochemistry and water quality at Duke’s Nicholas School of the Environment. “After more than a decade of fracking operation, we now have more years of data to draw upon from multiple verifiable sources. We clearly see a steady annual increase in hydraulic fracturing’s water footprint, with 2014 and 2015 marking a turning point where water use and the generation of flowback and produced water began to increase at significantly higher rates,” Vengosh said. “While the extraction of shale gas and tight oil has become more efficient over time as the net production of natural gas and oil from these unconventional wells has increased, the amount of water used for hydraulic fracturing and the volume of wastewater produced from each well have increased at much higher rates, making fracking’s water footprint much higher,” he added.
The Duke team published its peer-reviewed findings August 15 in Science Advances.
To conduct the study, they collected and analyzed six years of data on water use and natural gas, oil and wastewater production from industry, government and non-profit sources for more than 12,000 individual wells located in all major U.S. shale gas and tight oil producing regions. Then they used these historical data to model future water use and first-year wastewater volumes under two different scenarios.
The models showed that if current low oil and gas prices rise and production again reaches levels seen during fracking’s heyday in the early 2010s, cumulative water use and wastewater volumes could surge by up to 50-fold in unconventional gas-producing regions by 2030, and by up to 20-fold in unconventional oil-producing regions.
“Even if prices and drilling rates remain at current levels, our models still predict a large increase by 2030 in both water use and wastewater production,” said Andrew J. Kondash, a PhD student in Vengosh’s lab who was lead author of the paper.
A well’s wastewater is comprised chiefly of brines extracted with the gas and oil from deep underground, blended with some of the water initially injected into the well during hydraulic fracturing. These brines are typically salty and may contain toxic and naturally occurring radioactive elements, making them difficult to treat and dispose of safely. To keep up with the growing volume of wastewater now being generated, drilling companies increasingly are injecting it back deep underground into wastewater wells. This practice helps keep the wastewater out of local water supplies but has been linked to small- to medium-sized earthquakes in some locations.
“New drilling technologies and production strategies have spurred exponential growth in unconventional oil and gas production in the United States and, increasingly, in other parts of the world,” Kondash said. “This study provides the most accurate baseline yet for assessing the long-term environmental impacts this growth may have, particularly on local water availability and wastewater management.”
“Lessons learned from production development in the United States can directly inform the planning and implementation of hydraulic fracturing practices elsewhere as other countries such as China, Mexico and Argentina bring their unconventional natural gas reserves online,” he said.
Nancy E. Lauer, a 2018 doctoral graduate of Duke’s Nicholas School who now works as an environmental policy fellow at the Duke School of Law, co-authored the new research.
Funding came from the National Science Foundation.
From: https://nicholas.duke.edu/about/news/water-use-fracking-has-risen-770-percent-2011, last accessed 5/30/19
Questions for reflection:
- How much did water use per fracking well increase between 2011 and 2016?
- How much did wastewater generation from fracking increase between 2011 and 2016?
- What is one practice that drilling companies often use to dispose of the wastewater?
Water Contamination
There are three possible pathways for contaminants from hydraulic fracturing to enter the groundwater.
1. Contaminants leaking upward through fractures or faults in the rock from the site of the fracturing into drinking water aquifers. (See the diagram to the right.)
- Representatives of the industry are quick to point out that the zones they are fracturing are 1000’s of feet beneath any drinking water aquifers, making it very unlikely that such a scenario would occur. While it is correct that it is unlikely that activities at such depths would adversely impact our drinking water supplies, as a hydrogeologist, I personally have some concern about the shear numbers of “fracks” being done and the level of uncertainty about how the subsurface water-rock system will respond to dense clusters of fracking operations.
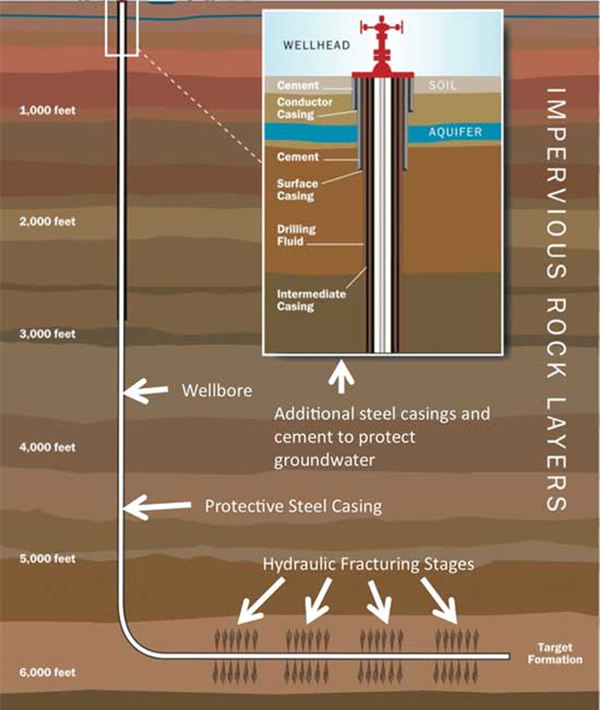
2. Improperly installed wells and/or failures in the seals (casing and cement in figure to the right) along the borehole that could allow drilling fluids,fracking fluids, and petroleum products to leak from the wells into drinking water aquifers.
- Drilling technologies and operations are highly specialized and well-tested, making the chances of such a failure slight. However, no engineering technology is fail proof. Again, in my opinion, simply due to the fact that there are so many fracking wells being drilled, it seems that there is a high chance of a small number of those wells having leaks.
3. Pollution from wastewater spills or leaks.
Wastewater generated during fracking activities is generally stored in lined surface water ponds until it can be treated or disposed of by injecting it deep underground. Leaks and spills of this wastewater probably present the greatest water quality threat from fracking. Read the article below about recent research suggesting that drinking water aquifers in some locations have been contaminated in this way.
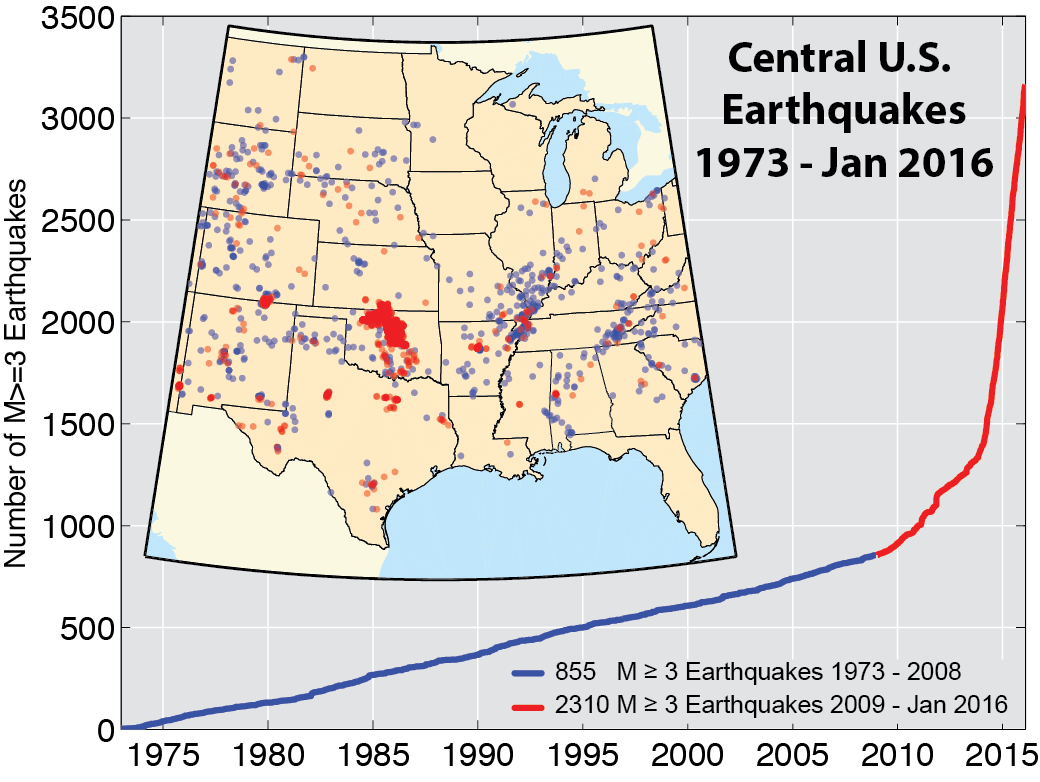
Human Induced Earthquakes
The practice of disposing of waste water generated during hydraulic fracturing by injecting it deep underground can create human induced earthquakes.
- The injected water lubricates existing fractures and faults.
- The injection process increases the water pressure on fractures and faults and thereby “forces” them to open up making it easier for the rocks to slip by each other.
As shown below, the rapid increase in the number of magnitude 3 and greater earthquakes beginning in 2009 is stunning evidence that wastewater injection by the fracking industry has induced earthquakes.
Click on the blue box below and read about human-induced earthquakes in Oklahoma. Reflect on the questions listed below the blue box.
Questions to Reflect On
- What was the magnitude of the Pawnee earthquake?
- What part of the fracking process was the main factor in causing the Pawnee earthquake?
- TRUE/FALSE: Fracking activities can increase the risk of earthquakes even years after fracking activity has stopped.
- What are some of the factors listed in the article that influence seismicity associated with fracking?
- According to the latest USGS earthquake hazard map how many people in the central US are at a risk of experiencing a damaging human-induced earthquake this year?
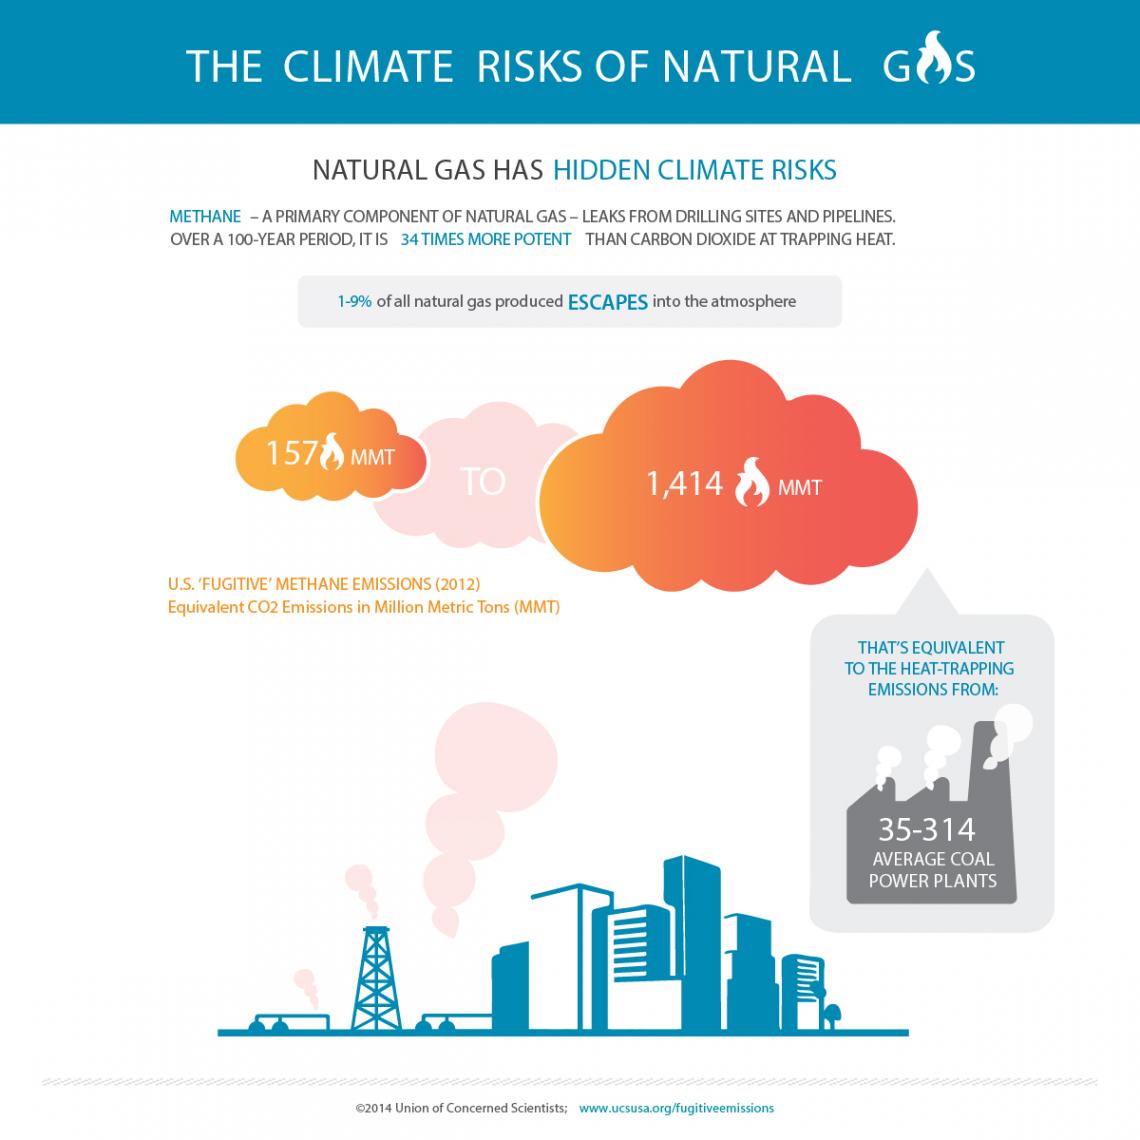
Greenhouse Gas Emissions
As shown in the diagram below, natural gas is a significant source of methane, CH4. Methane is a very potent greenhouse gas.
Air Pollution
Air pollution is another major concern associated with hydraulic fracturing. There are a number of sources of air pollution associated with fracking activities including…
- Release of volatile chemicals to the atmosphere during the time when gas and/or liquid petroleum are being brought to the surface.
- Particulate air pollution from the large volumes of silica sand that are used in the fracking process.
- Air pollution from the increased traffic and heavy equipment around drilling sites.
5.3 Tar Sands
What Are Tar Sands?
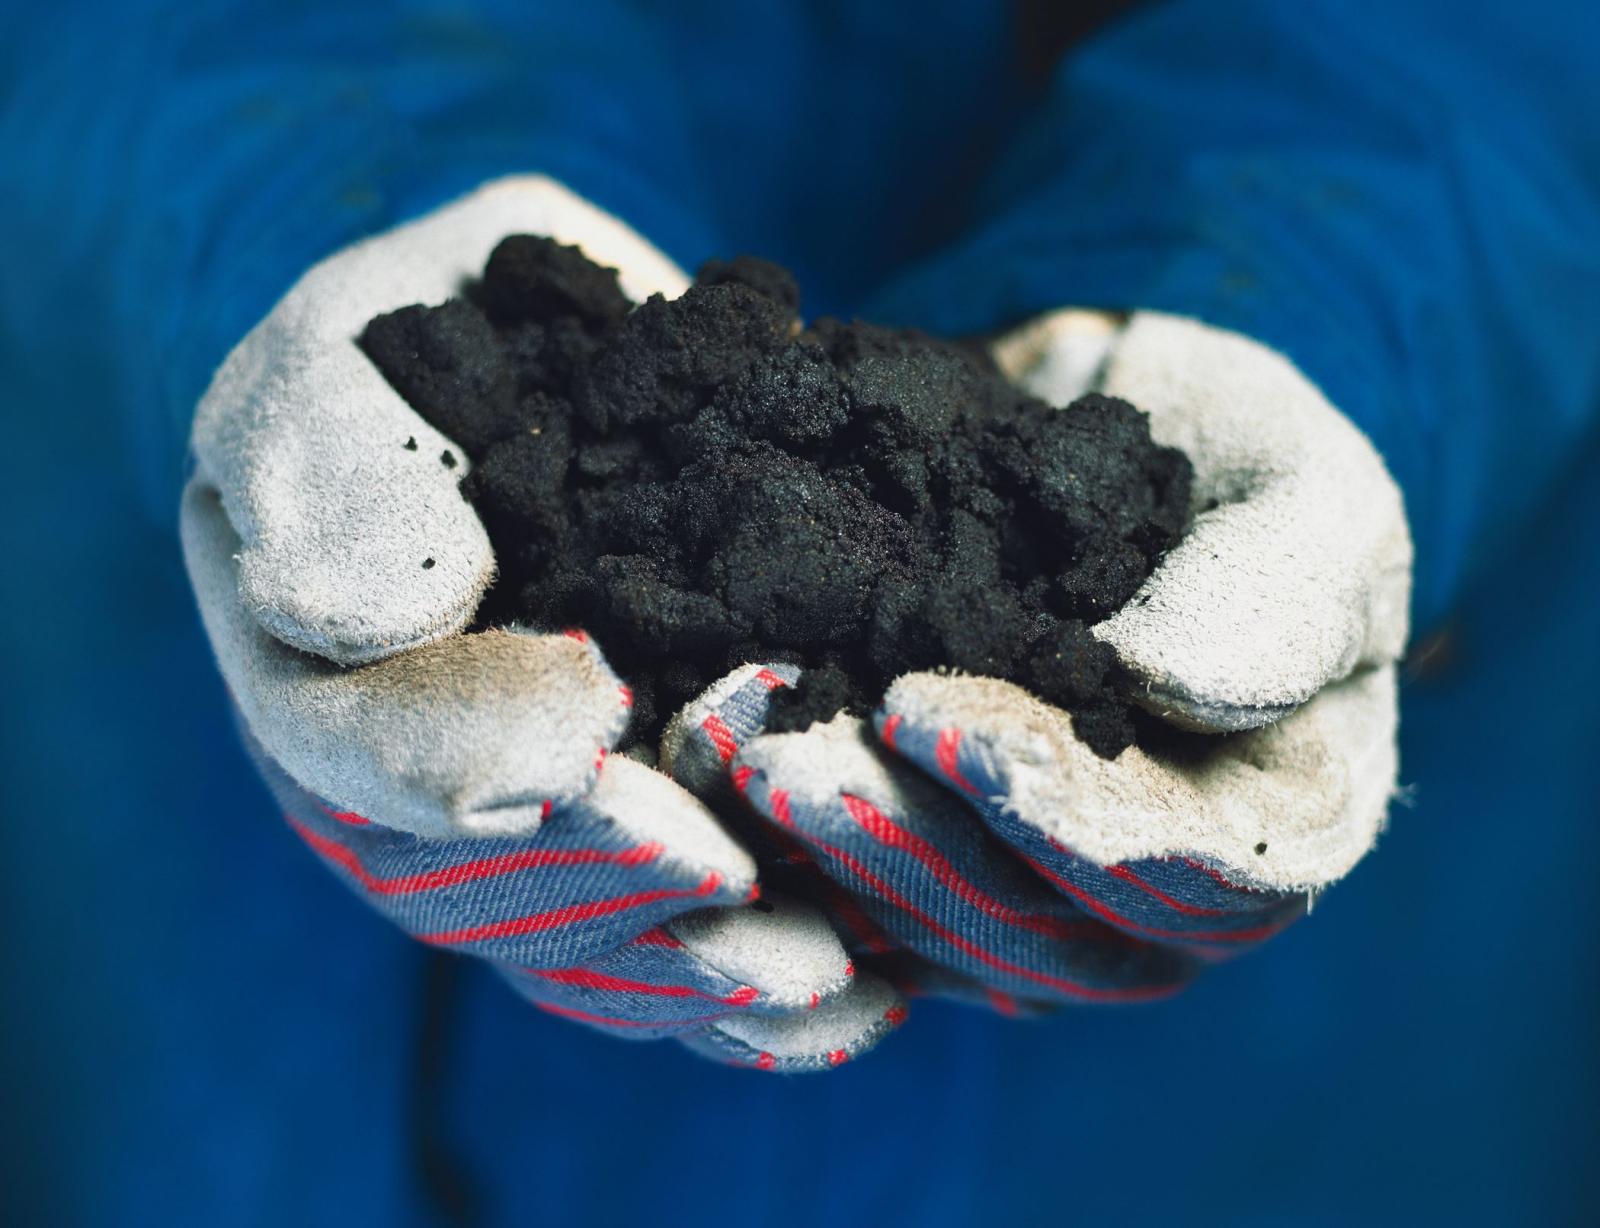
Tar sands are another unconventional source of oil.
As you can see from the photo to the right, tar sands are a mix of
- bitumen (a heavy, black, viscous oil)
- clay
- sand, and
- water
Where Do Tar Sands Occur?
Tar sands occur where bitumen comes to the surface as a seep or is in shallow sand deposits.
The Athabasca oil sands in Alberta, Canada are the world’s largest deposit tar sand deposit. There are a few other smaller deposits of tar sands in other places, including Utah.
How is Petroleum Produced from Tar Sands?
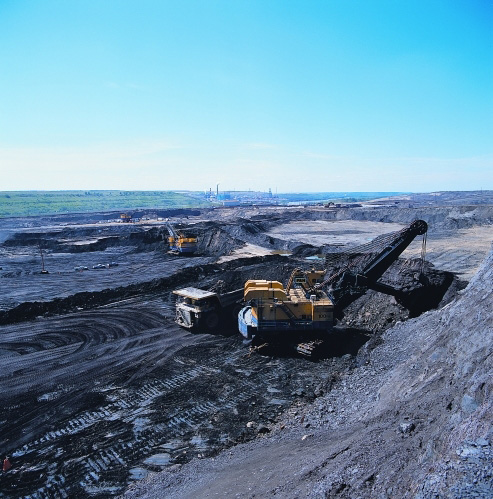
Surface mining
Shallow tar sand deposits are strip mined. Large volumes of sand are extracted and taken to a plant where hot water is used to separate the bitumen from the sand. Once separated, the bitumen is diluted with lighter hydrocarbons to make it thin enough to flow through pipelines.
It takes approximately two tons of tar sand to produce one barrel of oil.
As you can see from the picture to the right, the mining operations are huge and employ the world’s largest Caterpillar trucks, which have a payload close to 400 tons.
In-Situ Processing
Tar sand deposits that are too deep to be surface mined are processed in-situ. Horizontal wells are drilled near the bottom of the tar sand deposit and steam is injected into the deposit. The steam causes the bitumen to become less viscous and enables it to flow downward to an extraction well.
What Environmental Issues are Associated with Tar Sands?
Very similar to those associated with hydraulic fracturing…
- Water use
- Water contamination
- Air pollution
The production of tar sands also releases significantly more carbon dioxide to the atmosphere than other forms of oil production.
Additionally, as you can see from the photo above, the mining and processing tar sands has a huge footprint and results in a lot of ecological damage.
What is The Big Deal About the Athabasca Tar Sands?
They hold a lot of oil.
- 2.5 million barrels of oil per day for 186 years.
- Enough to supply roughly 13% of U.S. oil consumption.
At least until recently, the Athabasca tar sands were the largest segment of Alberta’s economy
- 30% of Alberta’s gross domestic product
- In 2009 and 2010, Alberta’s government received more the 3 billion dollars in royalties from oil companies.
A few years ago there was a big push to increase production from the Athabasca Tar Sands because oil prices were high. However, with the recent decline in oil prices, it is questionable how economically viable it is to produce oil from the tar sands. However, oil prices will not stay low forever. Read through the following excerpt to get a better feel for some of the economic and societal impacts of the tar sands. Be sure to reflect on the questions listed beneath the excerpt.
Excerpt from: Back to Bitumount: How the oilsands changed Alberta and Canada forever
CBCnews 5/9/17
By Bob Weber
…
In 2014 alone, the oilsands attracted $34 billion in investment.
Alberta, a jurisdiction of just over four million people, knocked back years of that. It was quite a party.
Corporate shindigs featured caviar and filet at the Calgary Stampede, where $100 hot dogs loaded with cognac and lobster sold out. Mobile homes in Fort McMurray sold for $400,000.
Competing with a black hole
A 17-year-old could make $80 an hour driving a truck. Retail sales staff in Alberta could expect to earn $5,000 a year more than elsewhere in the country.
Every year from 2000 to 2015, Alberta gained about 23,000 people at the expense of the other provinces. The Alberta economy grew by a fifth between 2010 and 2014.
That’s not necessarily good, Hirsch says.
“When you have one dominant industry that pulls so much capital, it turns into a bit of a black hole that has its own gravitational force and it pulls in everything around it including labour, capital, everything from office space to building materials to all kinds of talent.
“It makes it very difficult for other industries and non-energy sectors to compete.”
The industry has created enormous wealth, but it has left Alberta vulnerable.
“Everyone would like to have a more diverse economy, but when oil’s at $100 a barrel it pinches off any attempts,” says Hirsch….
‘We’ve painted ourselves into a corner’
The oilsands have also become an international issue.
At one point in 2010, arguments from environmental groups convinced six Fortune 500 companies to promise to avoid oilsands-derived fuel in their transportation fleet. Ad campaigns targeting the industry ran throughout the U.S. and in Europe.
Under attack, Albertans became more than a bit defensive about the industry that butters their bread.
“We are a bit on our back foot,” says Hirsch. “We’ve painted outselves into a corner where we find ourselves with a dependence on a commodity that the rest of the world is viewing unfavourably.”
Things, of course, have changed since 2014. Oil prices have collapsed from over $100 a barrel to about $50.
Analysts wonder if the age of megaprojects such as the $16.5-billion Fort Hills project – jointly owned by Suncor, Total and Teck Resources, next door to Bitumount – is nearing the end.
ExxonMobil and Chevron recently wrote down $183 billion of oilsands reserves in response to concerns from American securities regulators that they were no longer economic to produce.
And other multinationals are backing away from the resource.
Royal Dutch Shell recently sold most of its oilsands holdings to Canadian Natural Resources. Statoil has sold its oilsands assets to Athabasca Oil Corp. of Calgary.
Alberta actually lost people to other provinces last year.
Hirsch suggests the current oil price is Goldilocks – high enough to stabilize the industry and keep it profitable, low enough to leave economic space for diversification.
The problem for the Alberta government is that high-tech manufacturing or the renewable energy or advanced agri-food or tourism or engineering sectors may create tax revenue, but they don’t pay royalties.
“Royalties are really nice and easy to spend because you didn’t have to work very hard for them,” Hirsch says….
And the challenge of climate change – perhaps the biggest one the industry faces – has never gone away.
Industry has agreed to a hard cap of 100 megatonnes of carbon emissions, a limit that will be pretty much maxed out when projects now in the regulatory process are all built.
Industry says technological advances will eventually allow more production without CO2 growth, but it’s been saying that for a long time and possible solutions are a long way from commercially feasible.
Many analysts suggest that meeting Canada’s international greenhouse gas reduction goals will mean the country will simply have to walk away from some bitumen deposits.
Questions to Reflect On
- Discuss some of the financial benefits of Alberta’s tar sands.
- Discuss why the financial benefits of the tar sands are not necessarily good for long-term sustainability of Alberta’s economy.
- What environmental regulation will limit the development new tar sands production projects?
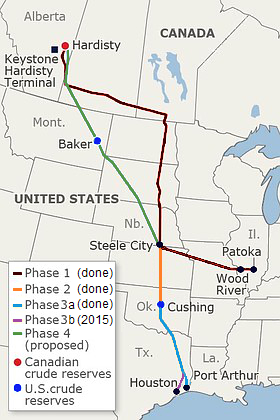
Keystone XL Pipeline
You might have heard about the Keystone XL pipeline in the news over the last few years. One of the primary purposes of the Keystone XL pipeline is to transport petroleum produced from the Athabasca tar sands in Alberta to refineries in the United States. Below are some highlights about the history of the Keystone XL pipeline.
- There are existing pipelines that transport oil from Canada to refineries along the US gulf coast. However, the Keystone XL pipeline would take a more direct route and would allow increased quantities of oil to flow to refineries.
- Keystone XL was approved by Canada’s national energy board in 2010, but President Obama never gave his approval for the pipeline. Obama stated that he did not think there was sufficient evidence that the pipeline would lower petroleum prices, create long-term jobs, or affect energy dependence.
- Very shortly after taking office President Trump gave his approval for construction of the pipeline to proceed, touting the number of jobs the project would create.
- Although Trump has given his approval for construction to proceed on the pipeline, there are still many hurdles to the pipeline being completed. Courts have blocked construction of the pipeline ruling that the Trump administration failed to conduct the necessary environmental review prior to approving construction. Additional lawsuits from homeowners who objective to the pipeline going through property are pending.
Some of the most significant environmental concerns associated with the pipeline are
- the possibility of spills of leaks from the pipeline
- the pipeline would support the United State’s dependence on “dirty” sources of petroleum
- the pipeline would help sustain production of the tar sands, which many people feel we should not be extracting, because of environmental impacts.
“Shipping dirtier crude oil into our country would not increase America’s energy security.”
Statement by President Obama about the Keystone XL Pipeline
Scroll through the Washington Posts’ slideshow below to get a better feel for some more of the environmental and social issues associated with the pipeline.
END OF MODULE 5